Software as a Service (SaaS) has transformed how businesses operate. Companies now rely on cloud-based tools for everything from accounting to team collaboration.
This comprehensive guide covers the latest SaaS statistics for 2026. You'll discover market trends, spending patterns, and growth projections.
Let's explore the numbers shaping the SaaS industry.
The SaaS Market Overview
The SaaS industry continues its remarkable expansion. The numbers tell an impressive story.
Global Market Size and Growth
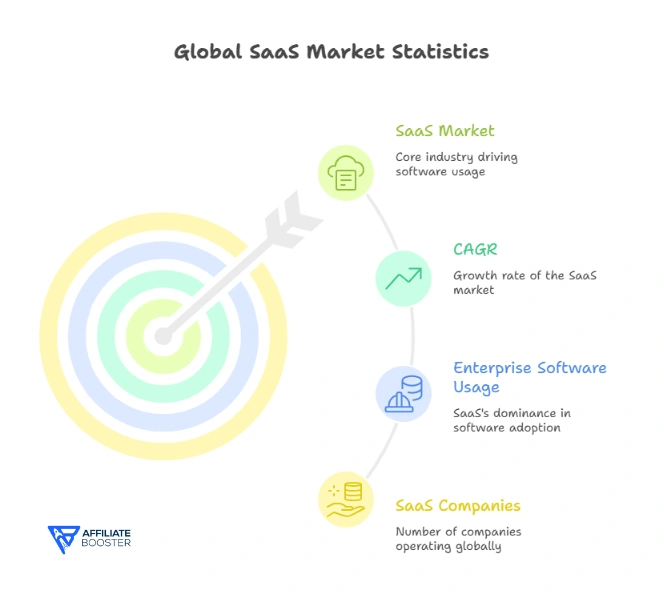
The SaaS market reached $317 billion in 2024. Analysts project it will hit $374 billion by 2026.
That represents an 18% growth rate. The industry shows no signs of slowing down.
Key market statistics include:
- Global SaaS market expected to reach $818 billion by 2030
- Compound annual growth rate (CAGR): 13.7%
- SaaS accounts for 70% of total enterprise software usage
- Over 30,000 SaaS companies operate globally in 2026
Regional Market Distribution
SaaS adoption varies by geography. Here's the breakdown:
| Region | Market Share | Growth Rate | Market Value 2026 |
| North America | 52% | 12.4% | $194.5 billion |
| Europe | 25% | 15.2% | $93.5 billion |
| Asia Pacific | 17% | 21.8% | $63.6 billion |
| Latin America | 4% | 18.9% | $15 billion |
| Middle East & Africa | 2% | 24.3% | $7.5 billion |
North America dominates the market. However, Asia Pacific shows the fastest growth rate.
Also read about: 11 Best AI Content Generator Software & Tools in 2026
SaaS Spending Trends
Companies invest heavily in SaaS solutions. The spending patterns reveal interesting insights.
Average SaaS Spend Per Company
Organizations allocate significant budgets to SaaS:
- Small businesses (1-50 employees): $10,000-$50,000 annually
- Mid-size companies (51-500 employees): $200,000-$1 million annually
- Large enterprises (500+ employees): $5 million-$50 million annually
- Average spend per employee: $6,775 (up from $5,350 in 2023)
SaaS Budget Growth
IT budgets increasingly favor SaaS:
- 78% of companies plan to increase SaaS spending in 2026
- Average budget increase: 23% year-over-year
- SaaS now represents 31% of total software budgets (up from 23% in 2022)
- Only 8% of companies plan to decrease SaaS investment
Hidden Costs and Waste
Many companies overspend on SaaS:
- Average SaaS waste per company: $18 million annually for enterprises
- 56% of SaaS licenses go unused or underutilized
- Duplicate applications cost companies $1.4 million yearly on average
- 42% of SaaS spend goes to redundant or overlapping tools
Also read about: 11 Best AI Content Generator Software & Tools in 2026
Number of SaaS Applications
SaaS sprawl creates management challenges. Companies use more tools than ever.
Average Applications Per Company
The number of apps continues climbing:
- Small businesses use an average of 102 SaaS applications
- Mid-size companies deploy 185 SaaS applications
- Large enterprises manage 371 SaaS applications on average
- This represents a 68% increase since 2021
Growth in SaaS Stack Size
Application counts grow rapidly:
- Companies add 8-12 new SaaS tools annually
- 73% of organizations say their SaaS portfolio will grow in 2026
- Average employee uses 12 SaaS applications daily
- Remote work increased SaaS usage by 47%
Most Common Application Categories
Certain SaaS categories dominate:
| Category | Percentage of Companies | Average Apps Per Category |
| Collaboration | 94% | 8.2 |
| Communication | 91% | 6.4 |
| Project Management | 87% | 5.1 |
| File Storage | 85% | 3.8 |
| Marketing | 83% | 11.7 |
| Sales & CRM | 81% | 7.3 |
| HR & Recruiting | 76% | 6.9 |
| Analytics | 74% | 5.6 |
| Customer Support | 71% | 4.2 |
| Finance & Accounting | 68% | 5.8 |
SaaS Adoption Statistics
SaaS adoption accelerates across industries. Nearly every business uses cloud software.
Overall Adoption Rates
SaaS has become the standard:
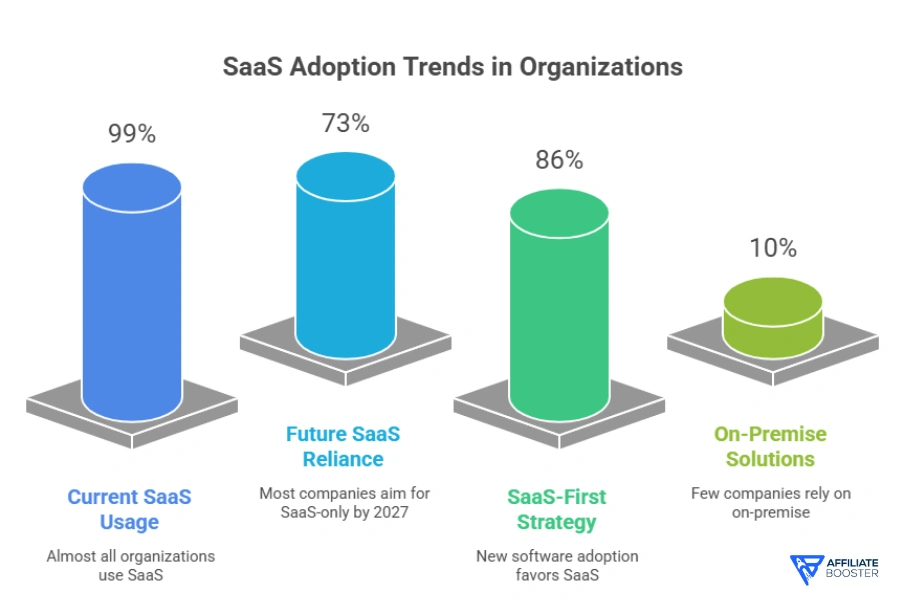
- 99% of organizations use at least one SaaS application
- 73% of companies plan to run almost entirely on SaaS by 2027
- 86% of businesses adopt SaaS-first strategies for new software
- Only 10% of companies maintain primarily on-premise solutions
Industry-Specific Adoption
Different sectors embrace SaaS at varying rates:
Technology Sector
- SaaS adoption rate: 97%
- Average applications: 412 per company
- Highest spending on development and collaboration tools
Healthcare
- SaaS adoption rate: 89%
- Growing rapidly for patient management and telemedicine
- Compliance concerns slow some adoption
Financial Services
- SaaS adoption rate: 91%
- Security requirements drive selective adoption
- Fintech companies use 350+ applications on average
Retail
- SaaS adoption rate: 88%
- E-commerce platforms drive adoption
- Point-of-sale and inventory management lead categories
Education
- SaaS adoption rate: 93%
- Learning management systems dominate
- Remote learning accelerated adoption by 156%
Company Size and Adoption
Organization size affects SaaS usage:
- Startups (1-10 employees): 48 applications on average
- Small businesses (11-50): 102 applications
- Mid-market (51-500): 185 applications
- Enterprise (500-1,000): 288 applications
- Large enterprise (1,000+): 371 applications
Also read about: 11 Best CRM Software and Tools in 2026
SaaS Security Statistics
Security remains a critical concern. The data reveals important trends.
Security Incidents and Breaches
SaaS security faces ongoing challenges:
- 67% of companies experienced at least one SaaS security incident in 2025
- Average cost of a SaaS data breach: $4.35 million
- 43% of breaches involve third-party SaaS applications
- Misconfiguration causes 68% of SaaS security incidents
Security Investment
Companies increase security spending:
- Average security spend: 15% of total SaaS budget
- 81% of organizations plan to increase SaaS security investment
- Cloud security market worth: $68.3 billion in 2026
- Security concerns delay SaaS adoption for 34% of companies
Common Security Concerns
Top security worries for IT leaders:
- Unauthorized access and sharing: 72%
- Data loss or leakage: 68%
- Compliance violations: 64%
- Shadow IT and unsanctioned apps: 61%
- Account takeovers: 58%
- Malware and ransomware: 54%
SaaS Management and Operations
Managing SaaS portfolios requires dedicated resources. The complexity grows with scale.
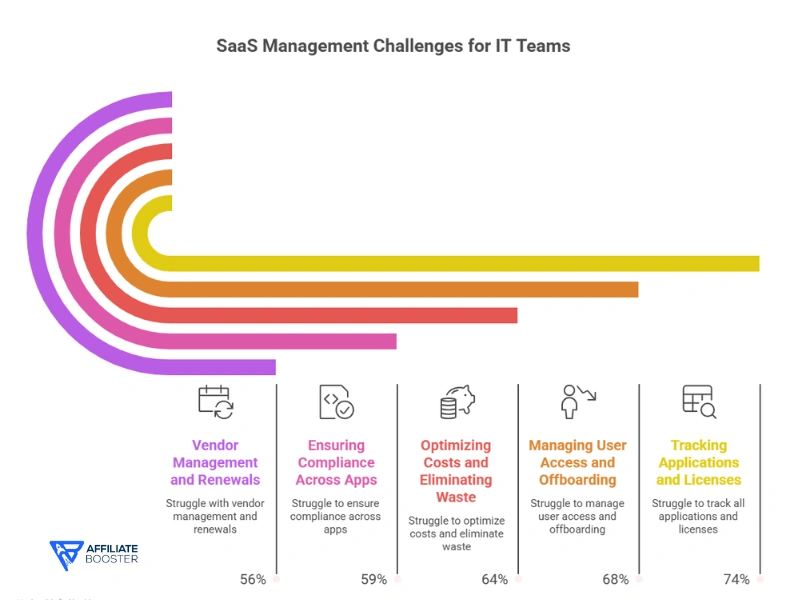
SaaS Management Challenges
IT teams face multiple obstacles:
- Tracking all applications and licenses: 74% struggle
- Managing user access and offboarding: 68%
- Optimizing costs and eliminating waste: 64%
- Ensuring compliance across apps: 59%
- Vendor management and renewals: 56%
SaaS Management Tools
Companies adopt management platforms:
- 64% of enterprises use SaaS management platforms (SMP)
- Average SMP cost: $45,000-$250,000 annually
- ROI from SMP implementation: 327% over three years
- SMPs identify $2.3 million in savings on average
Employee Onboarding and Offboarding
User lifecycle management creates challenges:
- Average time to provision all SaaS access: 4.2 days
- 47% of ex-employees retain access to at least one application
- Complete offboarding takes 3.8 days on average
- Orphaned accounts cost companies $1.8 million annually in security risks
Popular SaaS Applications
Certain SaaS tools dominate the market. Usage statistics reveal clear leaders.
Most Used SaaS Applications
The top applications by user count:
| Application | Category | Users Worldwide | Market Penetration |
| Microsoft 365 | Productivity | 435 million | 89% |
| Salesforce | CRM | 180 million | 67% |
| Slack | Communication | 24 million | 54% |
| Zoom | Video Conferencing | 350 million | 78% |
| Google Workspace | Productivity | 3 billion | 62% |
| Adobe Creative Cloud | Design | 30 million | 71% |
| Dropbox | File Storage | 700 million | 48% |
| HubSpot | Marketing | 184,000 companies | 41% |
| Atlassian Suite | Collaboration | 260,000 companies | 52% |
| ServiceNow | IT Management | 7,700 enterprises | 38% |
Fastest Growing SaaS Categories
New categories emerge rapidly:
- AI and machine learning platforms: Growth rate 234%
- Employee experience platforms: 156%
- Revenue operations tools: 142%
- Remote work enablement: 128%
- Cybersecurity mesh: 119%
Application Replacement Rates
Companies frequently switch tools:
- 29% of SaaS applications get replaced within 2 years
- Average contract length: 2.4 years
- 54% of companies consolidate vendors to reduce complexity
- Top reason for switching: Better features (68%)
SaaS Pricing and Revenue Models
SaaS companies use various pricing strategies. The models continue evolving.
Common Pricing Models
Different approaches to monetization:
- Per-user pricing: Used by 73% of SaaS companies
- Tiered pricing: 68%
- Usage-based pricing: 47% (fastest growing)
- Flat-rate pricing: 23%
- Freemium models: 38%
Average Customer Acquisition Cost
Getting new customers requires investment:
- B2B SaaS CAC: $702 (average)
- B2C SaaS CAC: $134 (average)
- Enterprise SaaS CAC: $1,450
- CAC payback period: 14 months (median)
Churn Rates and Retention
Customer retention drives SaaS success:
- Average annual churn rate (B2B): 6.5%
- Average monthly churn rate (B2C): 5.2%
- Best-in-class annual churn: Under 5%
- Companies with negative churn: 18% (expansion revenue exceeds churn)
SaaS Revenue Metrics
Key performance indicators:
| Metric | B2B Average | B2C Average | Enterprise |
| Annual Recurring Revenue Growth | 38% | 45% | 28% |
| Net Revenue Retention | 108% | 95% | 115% |
| Customer Lifetime Value | $18,750 | $2,140 | $127,500 |
| LTV:CAC Ratio | 3.2:1 | 2.8:1 | 4.1:1 |
| Magic Number | 0.85 | 0.72 | 0.91 |
Remote Work and SaaS
Remote work permanently changed SaaS usage. The pandemic accelerated digital transformation.
Remote Work Impact
Work-from-home drove SaaS adoption:
- Remote work increased SaaS usage by 47%
- Collaboration tools grew 312% from 2020-2026
- Video conferencing usage up 367%
- Virtual whiteboard apps increased 428%
Hybrid Work Requirements
Hybrid models create new needs:
- 68% of companies adopt permanent hybrid policies
- Hybrid work requires 23% more SaaS applications
- Asynchronous collaboration tools growing 156%
- Office hoteling and desk booking apps up 289%
AI and Machine Learning in SaaS
Artificial intelligence transforms SaaS capabilities. AI integration accelerates rapidly.
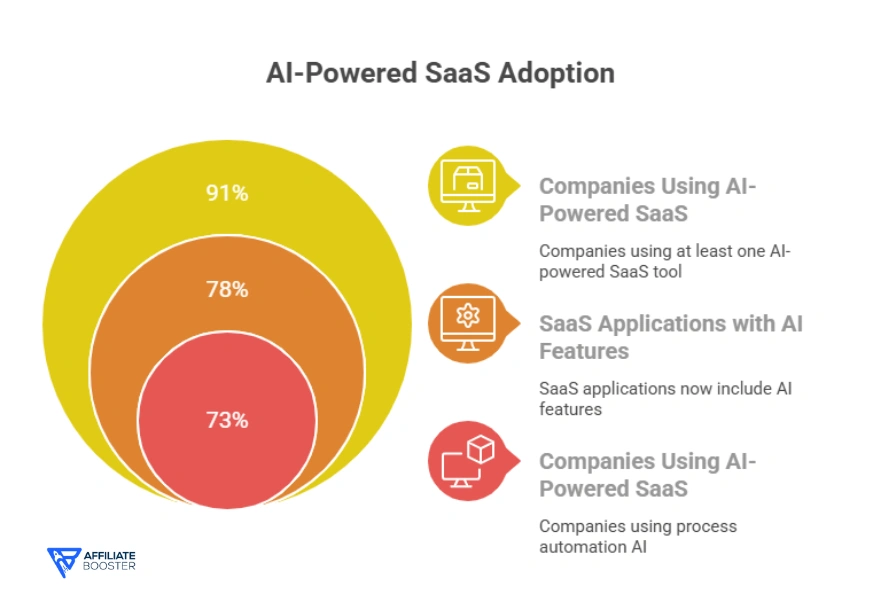
AI-Powered SaaS Adoption
AI features become standard:
- 78% of SaaS applications now include AI features
- AI-native SaaS market worth: $42 billion in 2026
- 91% of companies use at least one AI-powered SaaS tool
- AI features command 27% pricing premium on average
AI Use Cases in SaaS
Common AI applications:
- Customer support and chatbots: 82% of companies
- Predictive analytics: 71%
- Content generation: 64%
- Process automation: 73%
- Personalization engines: 68%
- Fraud detection: 56%
AI Impact on Productivity
AI drives measurable improvements:
- Average productivity increase: 37%
- Time saved on routine tasks: 6.2 hours weekly per employee
- Customer response time reduced by 68%
- Sales forecast accuracy improved by 42%
Mobile SaaS Statistics
Mobile access becomes essential. Users demand anywhere, anytime access.
Mobile Usage Trends
Mobile SaaS usage grows:
- 67% of SaaS applications offer mobile apps
- 43% of SaaS usage happens on mobile devices
- Mobile-first SaaS growing at 52% annually
- Average employee uses 8 SaaS apps on mobile daily
Mobile-Specific Challenges
Mobile creates unique issues:
- Security concerns on mobile: 73% of IT leaders
- BYOD (Bring Your Own Device) policies complicate management
- Mobile app sprawl affects 64% of companies
- Mobile-specific compliance issues: 48%
Integration and API Statistics
SaaS tools must work together. Integration complexity increases with app count.
Integration Needs
Connectivity becomes critical:
- Average SaaS application has 15 integrations
- 89% of companies cite integration as extremely important
- Integration challenges slow adoption for 52% of organizations
- Companies spend 17% of SaaS budget on integration
API Usage
APIs enable SaaS ecosystems:
- 94% of SaaS companies offer public APIs
- Average API calls per application: 1.2 million monthly
- API-first SaaS companies grow 34% faster
- 73% of developers use SaaS APIs in projects
iPaaS (Integration Platform as a Service)
Integration platforms simplify connectivity:
- iPaaS market size: $5.8 billion in 2026
- 58% of enterprises use iPaaS solutions
- Average cost savings from iPaaS: $780,000 annually
- Top platforms: Zapier, MuleSoft, Workato, Tray.io
Future SaaS Trends
The SaaS landscape evolves rapidly. Several trends will shape the future.
Vertical SaaS Growth
Industry-specific solutions gain traction:
- Vertical SaaS growing at 27% CAGR
- Market expected to reach $197 billion by 2028
- Healthcare vertical SaaS: $32 billion market
- Construction tech SaaS: $8.4 billion market
Micro-SaaS Opportunities
Single-purpose tools thrive:
- 23% of new SaaS companies are micro-SaaS
- Average micro-SaaS revenue: $50,000-$500,000 annually
- Lower competition in niche markets
- 67% of micro-SaaS companies are profitable within year one
Composable SaaS
Modular architectures gain popularity:
- 71% of companies prefer best-of-breed over suites
- Headless SaaS growing 89% annually
- API-first architectures become standard
- 84% of CIOs prioritize flexibility over integration
Embedded Finance
Financial features integrate everywhere:
- Embedded finance SaaS market: $28 billion in 2026
- 64% of non-financial SaaS apps offer payment features
- Embedded lending growing 156%
- Banking-as-a-service integration increasing
FAQs About SaaS Statistics
Also Read About:
- Apple Music Statistics
- Zoom Statistics
- ChatGPT Statistics
- Perplexity AI Statistics
- Meta AI Users Statistics
Conclusion
The SaaS industry continues its explosive growth in 2026. The market will reach $374 billion this year, with projections of $818 billion by 2030.
Companies increasingly depend on SaaS for core operations. The average enterprise now manages 371 applications. This creates both opportunities and challenges.
Key takeaways from the data:
SaaS spending increases 23% year-over-year. Organizations invest heavily in cloud solutions. However, significant waste persists, with $18 million lost annually to unused licenses.
Security remains paramount. 67% of companies faced security incidents in 2025. Investment in SaaS security grows as threats evolve.
AI integration accelerates rapidly. 78% of SaaS applications now include AI capabilities. These features drive 37% productivity improvements.
Remote and hybrid work permanently changed SaaS requirements. Collaboration tools grew 312% since 2020. This trend continues as flexible work becomes standard.
Successful SaaS management requires proper tools and governance. Companies using SaaS management platforms achieve 327% ROI. They identify millions in cost savings and security improvements.
The future brings vertical SaaS growth, micro-SaaS opportunities, and composable architectures. Organizations must balance innovation with cost control.
Start by auditing your current SaaS stack. Identify unused licenses and redundant tools. Implement proper governance and security controls. Choose applications that integrate well with your ecosystem.
The statistics prove SaaS dominates modern business. Strategic management ensures you maximize value while minimizing risk and waste.
Source: Satistics, Fortune Business Insights