The cryptocurrency landscape has transformed dramatically. What started as a niche technology now touches millions of lives worldwide.
This comprehensive guide reveals the latest crypto adoption statistics, user demographics, and market trends shaping 2026.
Global Cryptocurrency Ownership: The Big Picture

Cryptocurrency ownership has exploded globally. The numbers tell a compelling story of mainstream adoption.
As of 2026, approximately 560 million people own cryptocurrency worldwide. This represents about 6.9% of the global population.
The growth trajectory remains steep, with adoption increasing by roughly 35% year-over-year.
Regional Adoption Breakdown
Different regions show varying levels of crypto enthusiasm. Here's how adoption looks across continents:
| Region | Crypto Owners (Million) | Adoption Rate | Year-over-Year Growth |
| Asia-Pacific | 260 | 8.2% | 42% |
| North America | 85 | 18.5% | 28% |
| Europe | 95 | 12.1% | 31% |
| Latin America | 75 | 11.8% | 45% |
| Africa | 35 | 2.6% | 52% |
| Middle East | 10 | 4.2% | 38% |
Asia-Pacific leads in absolute numbers. However, North America shows the highest adoption rate percentage-wise. Africa demonstrates the fastest growth, despite lower absolute numbers.
Also read about: Top 15 Cryptocurrency Affiliate Programs to Monetize Your Crypto Blog
Top Countries by Crypto Adoption
Certain nations have embraced cryptocurrency more enthusiastically than others. The 2026 data reveals surprising leaders.
The Top 10 Crypto-Friendly Nations
- United States – 52 million users (15.6% population)
- India – 156 million users (10.9% population)
- Nigeria – 45 million users (20.3% population)
- Vietnam – 21 million users (21.2% population)
- Philippines – 18 million users (15.8% population)
- Brazil – 26 million users (12.1% population)
- Indonesia – 32 million users (11.4% population)
- Pakistan – 28 million users (12.3% population)
- Thailand – 9 million users (12.8% population)
- Russia – 17 million users (11.9% population)
Nigeria and Vietnam lead in population penetration. Their adoption rates exceed 20%, showing remarkable grassroots acceptance. India dominates in absolute numbers with 156 million users.
Demographics: Who's Buying Crypto?
Understanding who uses cryptocurrency helps paint a complete picture. The demographic data reveals interesting patterns.
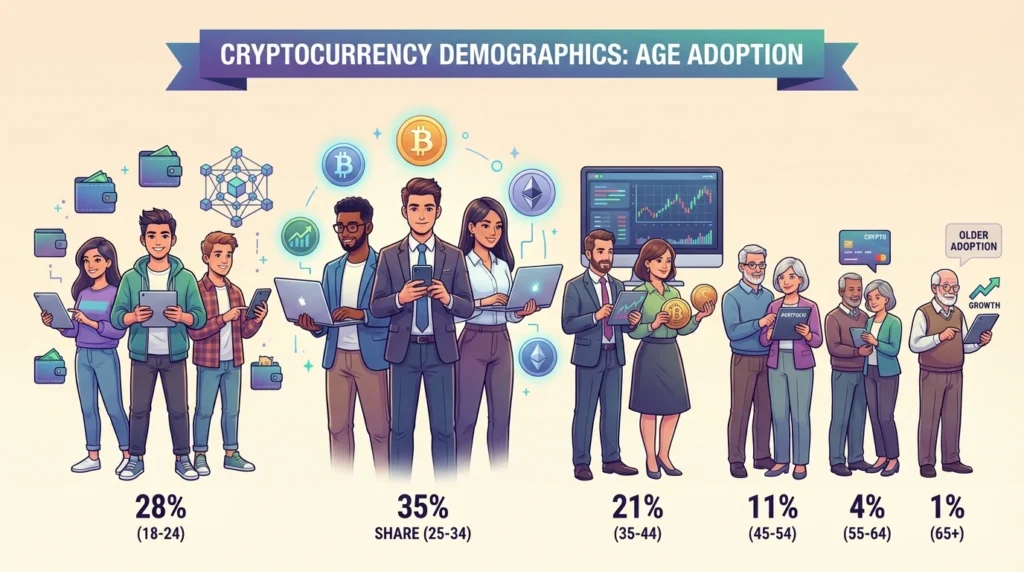
Age Distribution
Younger generations drive crypto adoption. However, older demographics are catching up quickly.
- 18-24 years: 28% of crypto owners
- 25-34 years: 35% of crypto owners
- 35-44 years: 21% of crypto owners
- 45-54 years: 11% of crypto owners
- 55-64 years: 4% of crypto owners
- 65+ years: 1% of crypto owners
The 25-34 age bracket represents the largest segment. They account for over one-third of all crypto owners. Generation Z (18-24) shows rapid growth, increasing their share by 6% in 2025 alone.
Gender Gap in Crypto
The gender distribution in crypto ownership has evolved. The gap is narrowing but remains significant.
Male crypto owners: 68%
Female crypto owners: 32%
Women's participation increased by 8% in 2025. Educational initiatives and user-friendly platforms contribute to this growth. Several countries show near-parity, including Vietnam and the Philippines.
Income and Education Levels
Crypto ownership correlates with education and income levels. However, this trend is changing.
By Education:
- College degree or higher: 45%
- Some college: 28%
- High school diploma: 22%
- Less than high school: 5%
By Annual Income:
- Under $25,000: 15%
- $25,000-$50,000: 28%
- $50,000-$100,000: 35%
- Over $100,000: 22%
Middle-income earners form the largest group. This democratization marks a shift from early crypto days when high-earners dominated.
Also read about: How Many Cryptocurrencies Are There In 2026?
Cryptocurrency Trading Volume and Market Size
The crypto market has matured significantly. Trading volumes and market capitalization reflect this evolution.
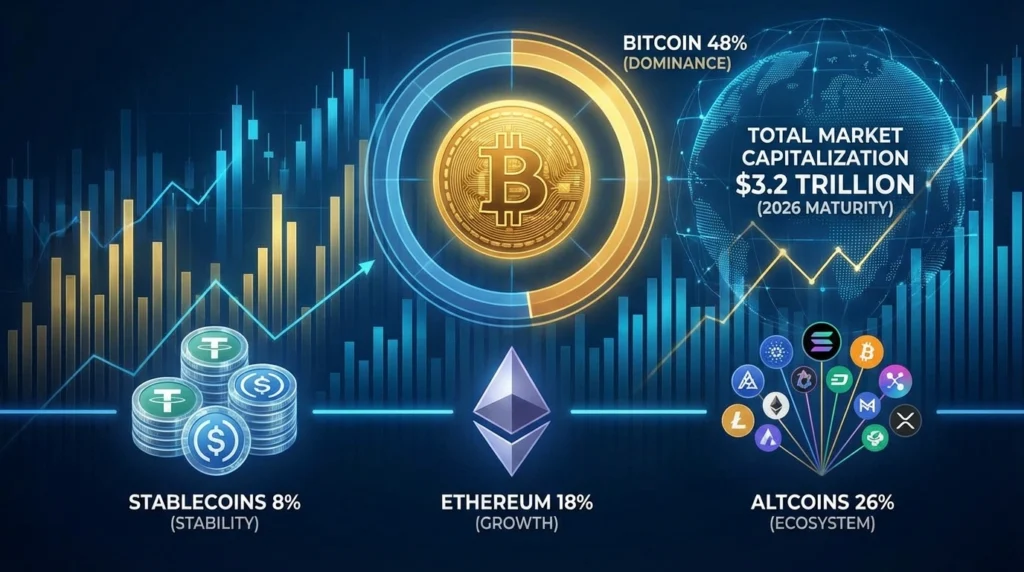
Market Capitalization Trends
Total crypto market cap (2026): $3.2 trillion
Bitcoin dominance: 48%
Ethereum market share: 18%
Stablecoins combined: 8%
Other altcoins: 26%
Bitcoin maintains its position as the dominant cryptocurrency. However, its market share has declined from 52% in 2024. Alternative cryptocurrencies gain ground steadily.
Daily Trading Volumes
Global cryptocurrency trading averages $195 billion daily in 2026. This represents a 41% increase from 2024 levels.
Top traded cryptocurrencies by daily volume:
| Cryptocurrency | Daily Volume (Billion $) | Market Share |
| Bitcoin (BTC) | 68 | 34.9% |
| Ethereum (ETH) | 45 | 23.1% |
| Tether (USDT) | 52 | 26.7% |
| BNB | 8 | 4.1% |
| Solana (SOL) | 7 | 3.6% |
| Others | 15 | 7.6% |
Stablecoins like Tether show massive trading activity. They serve as crucial bridges between fiat and crypto markets.
Stablecoin Adoption: The Silent Revolution
Stablecoins have emerged as crypto's killer application. Their adoption metrics deserve special attention.
Stablecoin Usage Statistics 2026
Total stablecoin market cap: $258 billion
Active stablecoin users: 185 million globally
Daily stablecoin transactions: 8.2 million
Stablecoins solve crypto's volatility problem. They enable practical use cases from remittances to everyday payments.
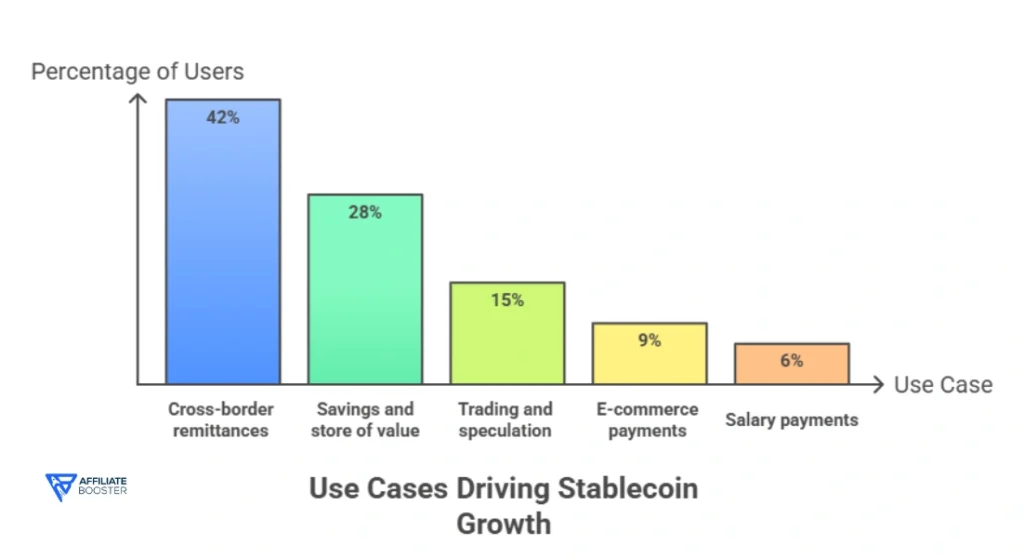
Use Cases Driving Stablecoin Growth
People use stablecoins for various purposes:
- Cross-border remittances: 42%
- Savings and store of value: 28%
- Trading and speculation: 15%
- E-commerce payments: 9%
- Salary payments: 6%
Remittances lead stablecoin usage. Migrant workers save significantly on transfer fees. Traditional remittance services charge 6-8% fees. Stablecoin transfers cost under 1%.
Top Stablecoins by Market Cap
| Stablecoin | Market Cap (Billion $) | Blockchain | Backing |
| Tether (USDT) | 142 | Multi-chain | USD-backed |
| USD Coin (USDC) | 65 | Multi-chain | USD-backed |
| DAI | 8.5 | Ethereum | Crypto-collateralized |
| BUSD | 6.2 | Binance Chain | USD-backed |
| FDUSD | 5.8 | Ethereum | USD-backed |
Tether dominates with 55% market share. USDC grows rapidly, particularly in institutional adoption.
Institutional vs. Retail Adoption
The crypto market now serves both retail and institutional investors. Their behavior patterns differ significantly.
Institutional Crypto Holdings
Number of institutions holding crypto: 18,400+
Total institutional crypto holdings: $892 billion
Percentage of total market: 27.9%
Major corporations now include Bitcoin on balance sheets. Institutional participation legitimizes the entire sector.
Notable institutional holders:
- MicroStrategy: 190,000 BTC
- Tesla: 11,500 BTC
- Block (Square): 8,027 BTC
- Marathon Digital: 28,000 BTC
- Galaxy Digital: 15,449 BTC
Retail Investor Behavior
Retail investors show different patterns. They prioritize smaller, high-growth altcoins more frequently.
Average retail crypto portfolio size: $4,850
Median number of different cryptocurrencies owned: 4.2
Trading frequency: 8.5 transactions per month
Retail investors display higher risk tolerance. They chase higher returns through smaller-cap projects.
Crypto Payment Adoption
Cryptocurrency as a payment method continues expanding. More merchants accept crypto globally.
Merchant Acceptance Statistics
Merchants accepting crypto worldwide: 38,000+
Online stores with crypto payment options: 125,000+
Year-over-year growth: 47%
The payment infrastructure has matured. Major payment processors now offer crypto integration.
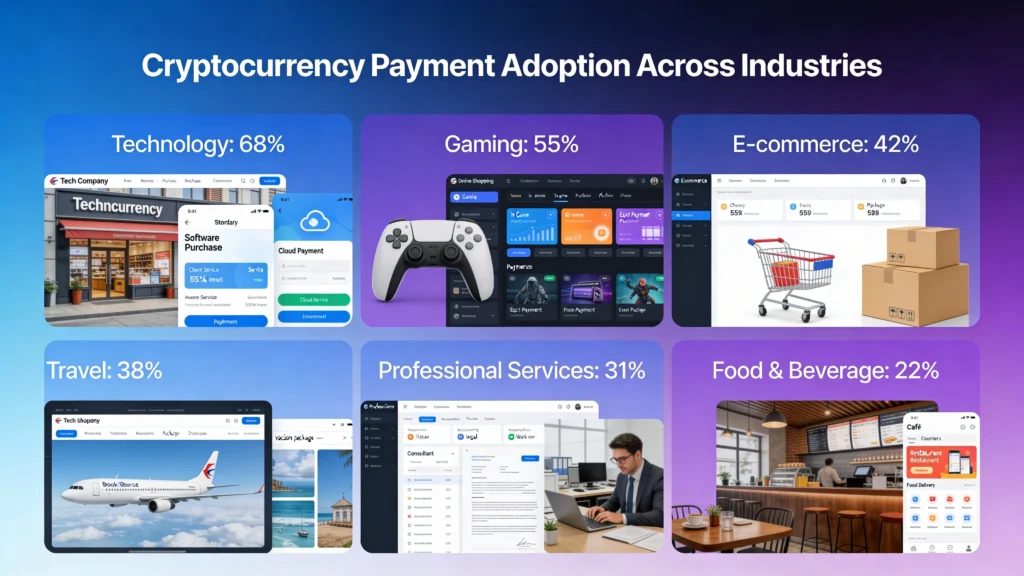
Top Industries Accepting Crypto
Different sectors show varying crypto acceptance levels:
- Technology & Software: 68% acceptance rate
- E-commerce & Retail: 42% acceptance rate
- Travel & Hospitality: 38% acceptance rate
- Gaming & Entertainment: 55% acceptance rate
- Food & Beverage: 22% acceptance rate
- Professional Services: 31% acceptance rate
Technology companies lead adoption. Gaming platforms embrace crypto enthusiastically for in-game purchases.
Consumer Payment Preferences
Not everyone uses crypto for payments equally. Survey data reveals actual usage:
- Use crypto for payments monthly: 32%
- Use crypto for payments quarterly: 28%
- Rarely use crypto for payments: 25%
- Never used crypto for payments: 15%
Most crypto owners hold their assets as investments. Only about one-third actively use crypto for purchases.
DeFi (Decentralized Finance) Adoption
DeFi represents crypto's most innovative application. Its growth metrics showcase blockchain's potential.
DeFi User Statistics 2026
Unique DeFi wallet addresses: 28 million
Total Value Locked (TVL): $185 billion
Average DeFi user portfolio: $6,600
DeFi allows financial services without traditional intermediaries. Users can lend, borrow, and trade autonomously.
Popular DeFi Activities
Users engage in various DeFi activities:
| Activity | Participation Rate | Average Amount Locked |
| Staking | 45% | $2,100 |
| Lending | 32% | $3,800 |
| Yield Farming | 28% | $4,200 |
| Decentralized Trading | 52% | $1,500 |
| Borrowing | 18% | $5,600 |
Decentralized trading leads in participation. Staking follows closely as users seek passive income.
NFT Market and Adoption
Non-Fungible Tokens (NFTs) carved their niche in the crypto ecosystem. The market has matured beyond initial hype.
NFT Ownership Statistics
Global NFT owners: 42 million
Total NFT market cap: $28 billion
Average NFT portfolio value: $890
NFT adoption slowed from 2021's peak. However, practical applications now drive sustainable growth.
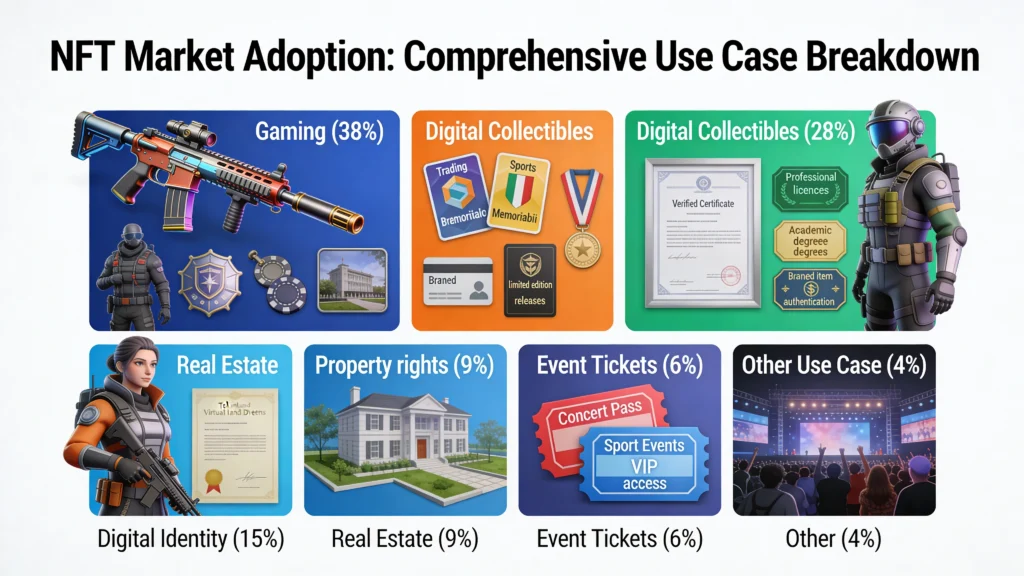
NFT Use Cases Beyond Art
NFTs expanded beyond digital art:
- Gaming items and assets: 38%
- Digital collectibles: 28%
- Digital identity and credentials: 15%
- Real estate and property rights: 9%
- Event tickets: 6%
- Music and media rights: 4%
Gaming leads practical NFT applications. Players genuinely value true ownership of digital items.
Blockchain Development and Infrastructure
Developer activity indicates ecosystem health. More developers mean more innovation.
Developer Community Growth
Active blockchain developers: 68,000+
Year-over-year growth: 34%
Open-source crypto projects: 125,000+
Developer interest remains strong. Ethereum and Bitcoin attract the most contributors.
Developers by blockchain:
- Ethereum: 28,000
- Bitcoin: 8,500
- Solana: 6,200
- Polygon: 5,800
- Binance Smart Chain: 4,900
Layer 2 Adoption
Layer 2 solutions address blockchain scalability. Their adoption accelerated in 2025-2026.
Total Layer 2 transaction volume: $425 billion
Layer 2 active addresses: 18 million
Cost savings vs. Layer 1: 95%
Arbitrum, Optimism, and Base lead Layer 2 adoption. They make Ethereum transactions affordable for average users.
Regulatory Landscape and Compliance
Regulation shapes crypto adoption significantly. Countries take different approaches.
Countries with Clear Crypto Regulations
- Countries with comprehensive frameworks: 78
- Countries with partial regulations: 102
- Countries with crypto bans: 9
El Salvador and Central African Republic adopted Bitcoin as legal tender. More countries explore Central Bank Digital Currencies (CBDCs).
Compliance-Related Statistics
- Licensed crypto exchanges globally: 485
- Regulated crypto custody providers: 230
- Countries requiring crypto tax reporting: 95
Compliance infrastructure grows robustly. Institutional adoption demands regulatory clarity.
Future Projections: Where Crypto is Headed
Current trends suggest continued growth. Several factors will influence adoption rates.
Projected Growth Through 2028
Analysts forecast significant expansion:
- Estimated crypto users by 2028: 850 million
- Projected market capitalization: $5.8 trillion
- Expected institutional allocation: 45%
Mainstream financial integration drives growth. Pension funds and insurance companies slowly enter the market.
Emerging Trends to Watch
Several developments will shape crypto's future:
- CBDC integration with private cryptocurrencies
- AI-enhanced trading and portfolio management
- Improved cross-chain interoperability
- Tokenization of real-world assets
- Enhanced privacy features and zero-knowledge proofs
- Environmental sustainability through proof-of-stake
These innovations will make crypto more accessible and practical.
Challenges Facing Crypto Adoption
Despite growth, obstacles remain. Understanding these challenges provides balanced perspective.
Main Barriers to Adoption
Survey data reveals what stops people from using crypto:
- Complexity and technical knowledge: 42%
- Security concerns and hacking risks: 38%
- Price volatility: 35%
- Regulatory uncertainty: 28%
- Lack of merchant acceptance: 22%
- Environmental concerns: 18%
User education remains crucial. Simplified interfaces can reduce the complexity barrier.
Security Statistics
Security incidents impact adoption negatively:
- Crypto stolen in hacks (2025): $1.8 billion
- Number of major security incidents: 127
- Users affected by exchange failures: 2.3 million
Despite improvements, security requires constant attention. Hardware wallets and multi-signature systems provide better protection.
Frequently Asked Questions
Also Read:
- SaaS Statistics
- Startup Statistics
- E-commerce Statistics
- Gaming Statistics
- Web Development Statistics
Conclusion
Cryptocurrency adoption has reached unprecedented levels in 2026. With 560 million global users, crypto has moved beyond early adopter phase into mainstream consciousness.
The data reveals several key insights. Younger demographics drive adoption, though older generations steadily increase participation. Emerging markets like Nigeria, Vietnam, and India show remarkable enthusiasm. Stablecoins prove crypto's practical utility beyond speculation.
Institutional adoption legitimizes the sector. Over 18,000 institutions now hold crypto assets worth nearly $900 billion. This professional participation brings stability and infrastructure improvements.
Challenges remain significant. Security concerns, regulatory uncertainty, and complexity still deter many potential users. However, each year brings better solutions, clearer regulations, and more user-friendly platforms.
The path forward looks promising. Projections suggest 850 million users by 2028. As blockchain technology matures and use cases multiply, cryptocurrency will continue integrating into global financial systems.
Whether crypto becomes truly mainstream depends on continued innovation, regulatory clarity, and real-world utility. Current statistics suggest the foundation is strong. The revolution has begun, and the numbers prove it's here to stay.
Source: Statista, Security.org