Over 5.66 billion people use social media worldwide in 2026. That's 68.7% of the global population. Social media has become a massive part of daily life for most people on Earth.
This article covers everything you need to know about social media usage in 2026. You'll find the latest statistics, user demographics, platform comparisons, and trends.
Social Media Statistics: Global Social Media Users in 2026
Social media usage continues to grow rapidly in 2026. The numbers are staggering.
How Many People Use Social Media Worldwide?
5.66 billion people actively use social media in 2026. This represents 68.7% of the total global population.
To put this in perspective:
That's more than 2 out of 3 people on Earth
Users now outnumber non-users 2 to 1
Social media users are now a “supermajority”
The growth doesn't stop. Social media added 259 million new users in the past year. That's a growth rate of 4.8% year-over-year.
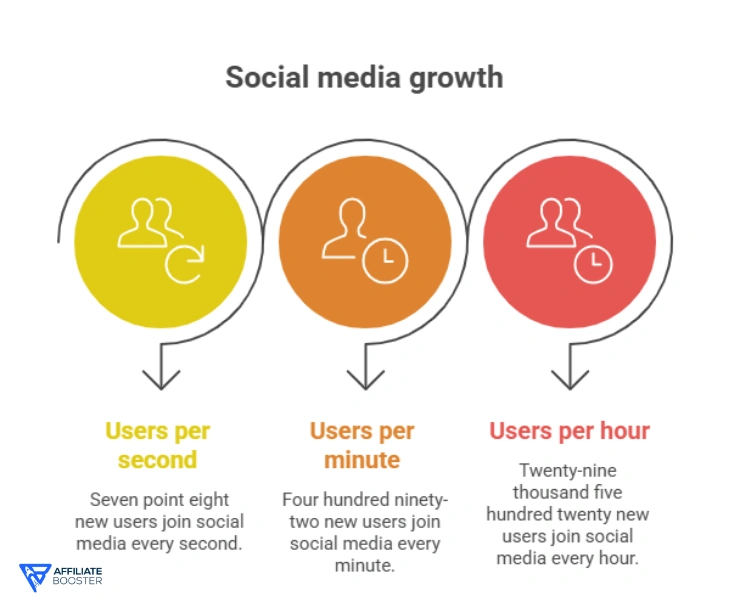
Real-time growth:
7.8 new users join social media every second
492 new users every minute
29,520 new users every hour
Social Media vs. Internet Users
Among internet users, social media penetration is even higher:
93.8% of internet users are on social media
That's nearly everyone with internet access
Only 6.2% of internet users don't use social media
The connection between internet and social media is clear. If you have internet, you probably use social media.
Also read about: Instagram Reels Statistics
Social Media Usage by Country
Social media usage varies dramatically by country. Some nations have adoption rates over 100%.
Top Countries by Social Media Users
Rank | Country | Number of Users | Key Facts |
1 | China | 1.18 billion | Expected to reach 1.36B by 2030 |
2 | India | 900+ million | Fastest growing market |
3 | United States | 253 million | 73% penetration rate |
4 | Indonesia | 190+ million | High mobile usage |
5 | Brazil | 165+ million | Strong engagement |
China leads with 1.18 billion social media users. India follows with massive growth potential.
Social Media Penetration Rates by Country
Some countries show penetration rates above 100%. This happens when people have multiple accounts.
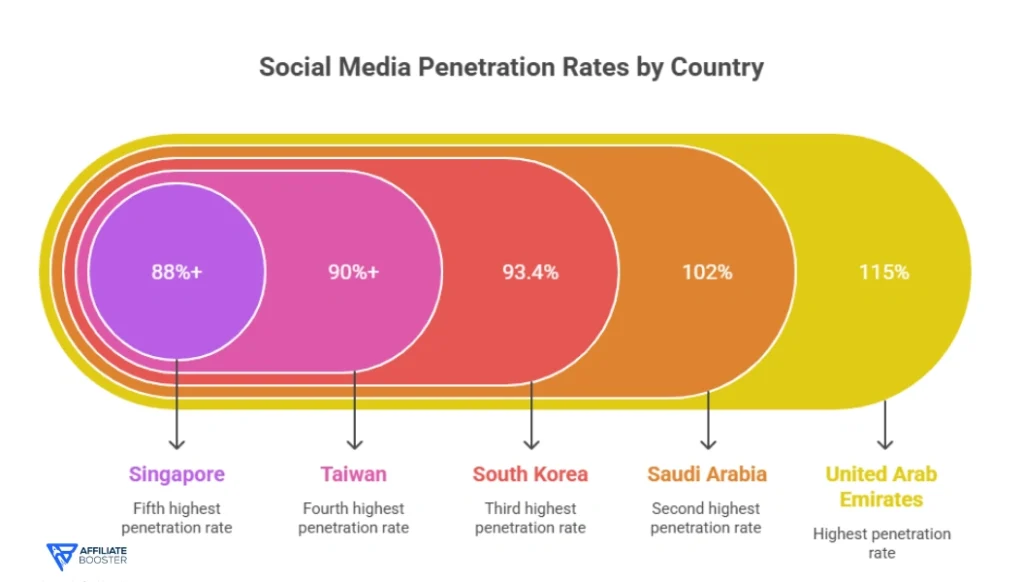
Highest Penetration Rates:
United Arab Emirates: 115%
Saudi Arabia: 102%
South Korea: 93.4%
Taiwan: 90%+
Singapore: 88%+
The UAE's 115% rate means more social accounts than people. Many users maintain multiple profiles across platforms.
United States Statistics:
253 million active users
73% of population uses social media
Average user has 6-7 platform accounts
Daily usage: 2 hours 9 minutes
Regional Social Media Distribution
Asia dominates global social media usage. Europe and Africa show different patterns.
Users by Region (2026)
Region | Percentage of Global Users | Growth Rate |
Asia | 60% | 14.1% YoY |
Europe | 12% | 3.8% YoY |
Africa | 11.5% | Rapid growth |
North America | 8% | Steady |
South America | 6.5% | Growing |
Oceania | 2% | Stable |
Asia leads with 60% of all social media users globally. That's roughly 3.4 billion users in Asia alone.
Europe shows the slowest growth at 3.8%. The market is mature and saturated.
Africa demonstrates rapid expansion. Mobile-first adoption drives growth in developing regions.
Also read about: YouTube Shorts Statistics
Time Spent on Social Media
People spend significant time on social platforms daily. The average keeps increasing.
Global Average Time
2 hours and 21 minutes – That's how long the average person spends on social media each day.
Breaking this down:
141 minutes daily
16.5 hours weekly
70 hours monthly
840 hours yearly
That's equivalent to 35 full days per year spent on social media.
Time Spent by Country
Different countries show vastly different usage patterns.
Top 10 Countries by Daily Usage:
Country | Daily Time on Social Media |
Brazil | 3 hours 32 minutes |
Philippines | 3 hours 25 minutes |
South Africa | 3 hours 20 minutes |
Kenya | 4+ hours |
Nigeria | 3 hours 15 minutes |
USA | 2 hours 9 minutes |
Australia | 1 hour 51 minutes |
UK | 1 hour 37 minutes |
South Korea | 1 hour 14 minutes |
Japan | 46 minutes |
Brazil leads with 3 hours 32 minutes daily. That's 90% more than the global average.
Japan shows the lowest at just 46 minutes daily. Cultural differences play a major role.
Top Social Media Platforms in 2026
Facebook remains the largest platform. But competition is fierce across all platforms.
Social Media Platforms by Active Users
Platform | Monthly Active Users | YoY Growth | Key Demographics |
3.22 billion | Stable | All ages, global | |
YouTube | 2.85 billion | Growing | Cross-generational |
2.5-3 billion | Growing | Messaging-focused | |
2.20 billion | 10%+ growth | Ages 18-44 | |
TikTok | 1.70 billion | 15%+ growth | Ages 16-34 |
1.3 billion | Stable | China-focused | |
Facebook Messenger | 980 million | Stable | Messaging |
Telegram | 900 million | Growing | Privacy-focused |
Snapchat | 750 million | Moderate | Ages 13-24 |
X (Twitter) | 600 million | Declining | News-focused |
1.2 billion | 8% growth | Professional | |
850 million | Strong growth | Discussion-based | |
500 million | Stable | Visual discovery | |
Threads | 300 million | New platform | Meta ecosystem |
Facebook dominates with 3.22 billion users. Despite competition, it remains number one.
YouTube follows closely at 2.85 billion. It serves as both social platform and search engine.
TikTok shows the strongest growth at 15% yearly. Young users drive this expansion.
Platform Preferences
Users have favorite platforms for different purposes.
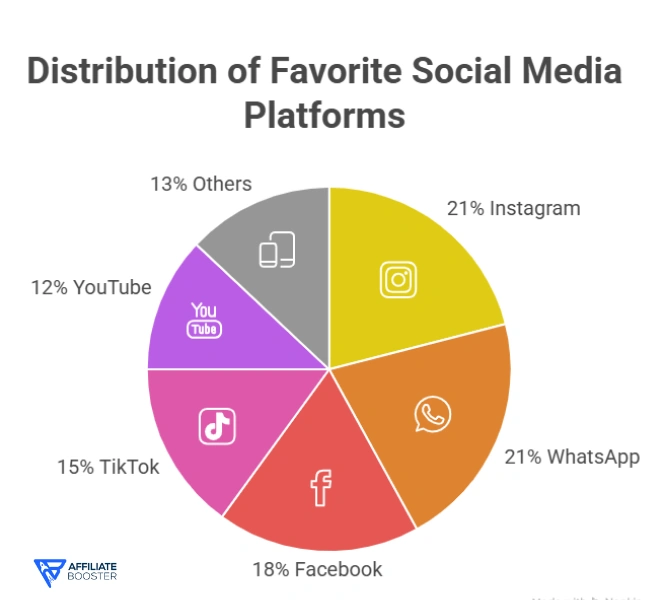
Favorite Platform Survey Results:
Instagram: 21% (most liked)
WhatsApp: 21% (tied for first)
Facebook: 18%
TikTok: 15%
YouTube: 12%
Others: 13%
Instagram and WhatsApp tie as users' favorite platforms. Facebook ranks third despite having more users.
Average Number of Platforms per User
Modern users don't stick to one platform. They spread across multiple apps.
How Many Platforms Do People Use?
The average user engages with 6.83 different social media platforms monthly.
Platform Usage by Region:
UAE: 8.63 platforms (highest globally)
Global Average: 6.83 platforms
Japan: 3.49 platforms (lowest)
Young users maintain more platform accounts than older adults. Females show slightly higher multi-platform usage.
Why Multiple Platforms?
Different purposes for each platform
Reach different friend groups
Content variety across platforms
Platform-specific features
Work vs. personal separation
Social Media Demographics
User demographics vary significantly across platforms and regions.
Gender Distribution
Globally, social media skews slightly male.
Global Gender Split:
Men: 54.6%
Women: 45.4%
But this varies by region dramatically.
Gender Distribution by Region:
Region | Female % | Male % |
North America | 50% | 50% |
South America | 52% | 48% |
Western Europe | 50% | 50% |
Southern Africa | 49% | 51% |
Southern Asia | 34% | 66% |
South-Eastern Asia | 49% | 51% |
Oceania | 50% | 50% |
Southern Asia shows the biggest gender gap with 66% male users.
Most Western regions show balanced 50/50 splits.
Gender by Platform
Different platforms attract different gender distributions.
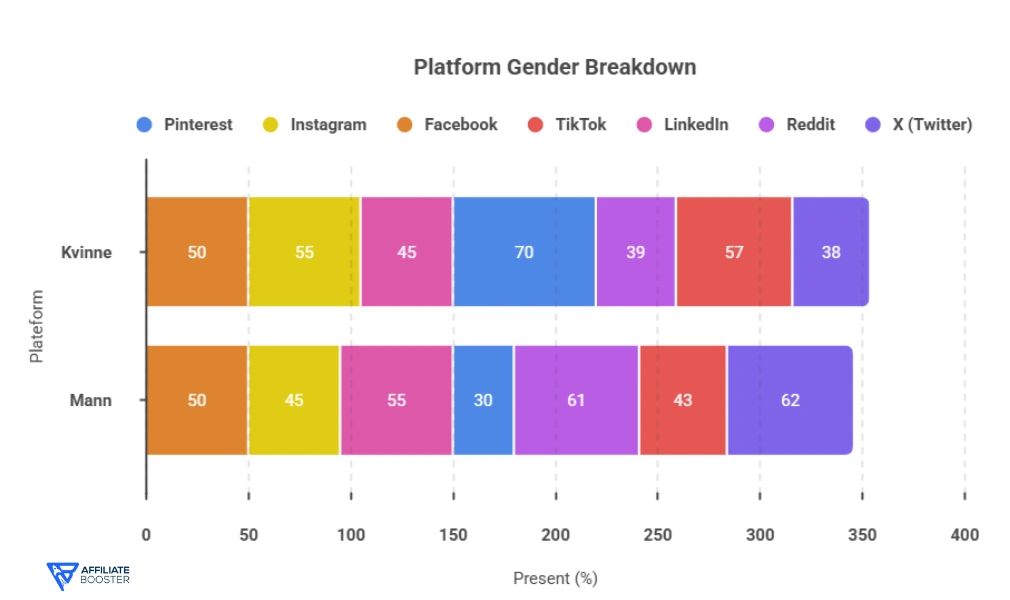
Platform Gender Breakdown:
Pinterest: 70%+ female
Instagram: 55% female, 45% male
Facebook: 50% female, 50% male
TikTok: 57% female, 43% male
LinkedIn: 45% female, 55% male
Reddit: 39% female, 61% male
X (Twitter): 38% female, 62% male
Pinterest dominates as the most female-skewed platform.
Reddit and X attract predominantly male audiences.
Age Distribution
Age plays a huge role in platform choice.
Social Media Usage by Age (US):
Ages 18-29: 90% use social media
Ages 30-49: 82% use social media
Ages 50-64: 73% use social media
Ages 65+: 45% use social media
Younger generations show near-universal adoption.
Platform Preferences by Age:
Ages 18-29 Most Used:
Instagram (80%)
TikTok (70%)
Snapchat (65%)
YouTube (90%+)
Ages 30-49 Most Used:
Facebook (80%)
YouTube (85%)
Instagram (60%)
Ages 50-64 Most Used:
Facebook (75%)
YouTube (75%)
LinkedIn (35%)
Ages 65+ Most Used:
Facebook (60%)
YouTube (55%)
YouTube stands out as cross-generational. Over 90% of adults under 50 use it.
Why People Use Social Media
Understanding motivations helps explain the massive adoption rates.
Top Reasons for Social Media Usage
Main Motivations (% of users):
Staying connected with friends/family: 50.8%
Reading news stories: 35.2%
Finding entertaining content: 33.5%
Sharing photos/videos: 30.1%
Following brands/products: 27.3%
Professional networking: 22.8%
Finding inspiration: 21.5%
Learning new skills: 19.2%
Keeping in touch tops the list across all age groups.
Older users (45+) prioritize news consumption.
Younger users (16-24) focus on entertainment and content sharing.
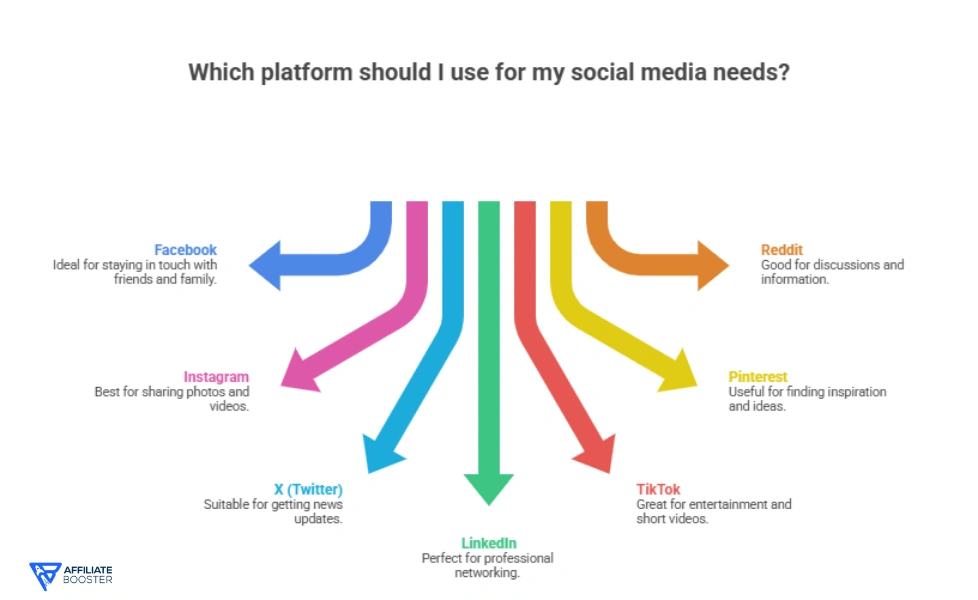
Use Cases by Platform
Different platforms serve different purposes.
Platform Primary Uses:
Facebook: Keeping in touch (73.1%)
Instagram: Sharing photos/videos (70.2%)
X (Twitter): News updates (60.5%)
LinkedIn: Professional networking (85%)
TikTok: Entertainment (78%)
Pinterest: Finding inspiration (82%)
Reddit: Discussions and information (65%)
Users choose platforms strategically based on their needs.
Social Media Growth Trends
Social media keeps expanding. Growth patterns reveal interesting insights.
Historical Growth
Social media usage has exploded over the past decade.
Year-by-Year Growth:
Year | Users (Billions) | Growth Rate |
2015 | 2.07 | – |
2016 | 2.31 | 11% |
2018 | 3.20 | 19% |
2020 | 3.96 | Steady |
2023 | 4.88 | 10% |
2025 | 5.24 | 7% |
2026 | 5.66 | 4.8% |
Usage has more than doubled since 2015. That's 3.59 billion new users in 11 years.
Growth rate is slowing but still positive. The market approaches saturation in developed countries.
Future Projections
Where is social media headed?
Expected Trends:
Continued growth in developing markets
Africa and Asia driving expansion
Mature markets showing minimal growth
Mobile-first platforms dominating
Short-form video continuing to rise
Experts project 6+ billion users by 2028. That would represent over 70% of the global population.
Mobile vs. Desktop Usage
Mobile dominates social media access. Desktop usage continues declining.
Device Preferences
92% of social media access happens on mobile devices.
Device Breakdown:
Mobile only: 78%
Desktop only: 2%
Both mobile and desktop: 20%
Mobile-first platforms like TikTok and Instagram see 95%+ mobile usage.
Facebook shows more balanced usage with 70% mobile, 30% desktop.
LinkedIn maintains higher desktop usage due to professional/work context.
Social Media and Mental Health
Reddit and Quora discussions reveal growing concerns about social media's impact.
Common Discussion Themes
From Reddit threads (2026):
Positive Impacts:
Staying connected with distant friends
Finding supportive communities
Access to information and news
Professional networking opportunities
Creative expression and sharing
Negative Impacts:
Mental health challenges
Comparison and envy
Privacy concerns
Addiction and time waste
Misinformation spread
AI-generated spam content
Top Reddit Complaints:
Fake content and bots
Echo chambers
Privacy tracking
Declining content quality
Algorithm manipulation
Mental Health Statistics
Research shows significant impacts:
69% of adults report social media affects their mental health
54% say it increases anxiety
48% report feeling pressure to present perfect lives
41% experience FOMO (fear of missing out)
But 67% also say social media helps them stay connected and reduces loneliness.
Social Commerce and Shopping
Social media becomes a digital marketplace. Shopping integration increases.
Social Commerce Statistics
27.3% of users use social media to follow brands and research products.
Shopping Behavior:
1 in 7 global shoppers will primarily shop on social media within 5 years
TikTok: Nearly half of users make purchases
Instagram: 139 million Reels watched every minute
Facebook Shops: Growing e-commerce presence
Platform Shopping Rankings:
TikTok (highest conversion)
Instagram (visual discovery)
Facebook (wide reach)
Pinterest (product inspiration)
Social media advertising spending exceeds $300 billion globally in 2026.
Emerging Platforms and Trends
New platforms emerge while established ones evolve.
Rising Platforms (2026)
Threads: 300 million users (Meta's Twitter alternative) Bluesky: 26 million users (decentralized platform) BeReal: Growing among Gen Z Mastodon: Privacy-focused alternative
Reddit shows strong growth to 850 million monthly active users. Up 13.2% year-over-year.
Content Trends
Short-form video dominates:
TikTok videos
Instagram Reels
YouTube Shorts
Facebook Reels
Text-based social makes a comeback:
Threads gaining traction
X (Twitter) maintaining news focus
Reddit discussions growing
AI integration increases:
AI-generated content tools
Automated posting
Smart recommendations
Deepfake concerns
Influencer Marketing Growth
Influencer marketing spending surpasses traditional digital advertising in 2026.
Influencer Statistics
31% of social media users ages 16-24 follow influencers. That's the highest among all age groups.
Influencer Marketing Spend:
Expected to exceed traditional digital ad spending
Brands shift budgets toward influencer partnerships
Micro-influencers (10K-100K followers) see highest engagement
Nano-influencers (1K-10K) deliver best ROI
Platform Preferences for Influencers:
Instagram (most popular)
TikTok (highest engagement)
YouTube (long-form content)
Twitch (gaming/streaming)
Business and Marketing Impact
Social media transforms how businesses reach customers.
Marketing Statistics
78% of brands use social media to build brand awareness.
Business Goals:
Brand awareness: 78%
Increase engagement: 47%
Connect with customers: 46%
Drive website traffic: 44%
Generate leads: 41%
ROI by Platform (B2B):
LinkedIn: 85% say it drives most ROI
YouTube: Strong video ROI
Facebook: Broad reach
Instagram: Visual engagement
ROI by Platform (B2C):
Instagram: Visual products
Facebook: Community building
TikTok: Viral potential
Pinterest: Purchase intent
Content Preferences
Video content dominates:
89% of marketers use social videos
73% prefer explainer videos
Short-form video performs best
Live streaming growing
Post Format Performance:
Carousel posts: 24% more popular in 2026
Single images: Declining
Video posts: Rising
Text posts: Platform-dependent
Frequently Asked Questions (FAQs)
How many people use social media in 2026?
5.66 billion people use social media worldwide in 2026. This represents 68.7% of the global population and 93.8% of internet users. Social media added 259 million new users in the past year.
What is the most popular social media platform?
Facebook remains the largest with 3.22 billion monthly active users. YouTube follows with 2.85 billion users. However, Instagram and WhatsApp tie as users' favorite platforms (21% preference each).
How much time do people spend on social media daily?
The global average is 2 hours and 21 minutes daily. This varies by country: Brazil averages 3 hours 32 minutes, the USA averages 2 hours 9 minutes, and Japan only 46 minutes per day.
Which countries have the most social media users?
Top 5 countries: China (1.18 billion), India (900+ million), United States (253 million), Indonesia (190+ million), and Brazil (165+ million). The UAE has the highest penetration rate at 115%.
What age group uses social media the most?
Ages 18-29 show highest usage at 90% in the US. Ages 30-49 follow at 82%. Usage drops with age: 73% for ages 50-64 and 45% for 65+. However, YouTube attracts all age groups with over 90% of adults under 50 using it.
Is social media usage still growing?
Yes, social media grows at 4.8% annually. That's 7.8 new users every second. Growth is fastest in developing markets like Asia (14.1% growth) and Africa. Mature markets like Europe show slower growth (3.8%).
Also Read:
Conclusion
Social media has become a fundamental part of modern life. With 5.66 billion users worldwide, it reaches more than 2 out of 3 people on Earth.
The numbers are staggering:
68.7% of the global population uses social media
Users spend 2 hours 21 minutes daily on platforms
People engage with an average of 6.83 different platforms
259 million new users joined in the past year
Facebook leads with 3.22 billion users. But platforms like TikTok and Instagram show strongest growth. Young users drive adoption of new platforms.
Regional differences are massive. Asia accounts for 60% of all users. The UAE shows 115% penetration with multiple accounts per person. Meanwhile, developed markets approach saturation.
Social media serves many purposes. People stay connected, share content, follow news, shop, and build communities. Platforms evolve to meet these diverse needs.
Concerns about mental health, privacy, and content quality persist. Reddit and Quora discussions reveal user frustrations with AI spam and fake content. But overall usage continues growing.
For businesses, social media is essential. Marketing budgets shift toward influencer partnerships and video content. Social commerce transforms how people discover and buy products.
The future looks mobile-first, video-focused, and increasingly integrated into daily life. With 6+ billion users projected by 2028, social media will only become more central to how we communicate, work, and connect.
Whether for personal connection or business growth, understanding these statistics helps navigate the social media landscape effectively in 2026 and beyond.
Source: Statista, StatCounter