E-commerce has transformed retail forever. Online shopping continues breaking records year after year.
This comprehensive guide covers e-commerce statistics for 2026. You'll discover market size, consumer behavior, and growth projections. Let's explore the numbers shaping digital retail.
Global E-commerce Market Overview
The e-commerce industry reaches unprecedented scale. Growth accelerates worldwide.
Market Size and Revenue
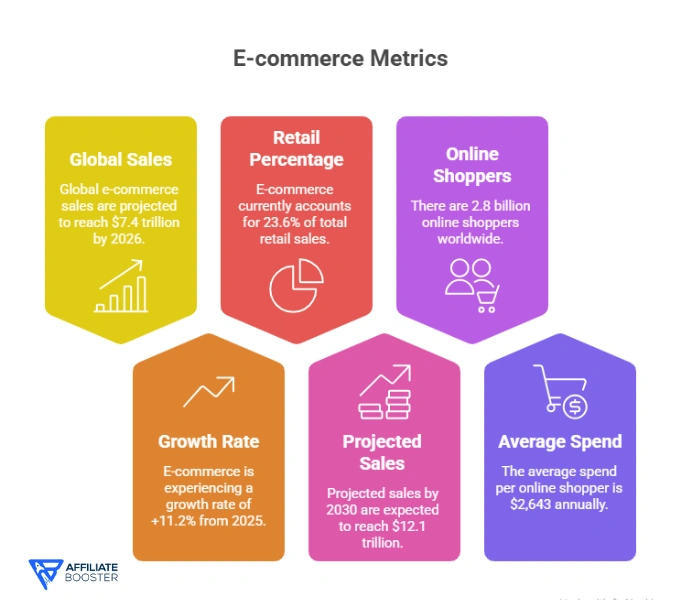
Global e-commerce performance metrics:
- Global e-commerce sales (2026): $7.4 trillion
- Growth from 2025: +11.2%
- E-commerce as percentage of total retail: 23.6%
- Projected sales by 2030: $12.1 trillion
- Online shoppers worldwide: 2.8 billion people
- Average spend per online shopper: $2,643 annually
Regional Market Distribution
E-commerce varies by geography:
| Region | Market Size 2026 | Growth Rate | Market Share |
| Asia Pacific | $4.1 trillion | 13.4% | 55.4% |
| North America | $1.5 trillion | 8.7% | 20.3% |
| Europe | $1.2 trillion | 9.2% | 16.2% |
| Latin America | $387 billion | 16.8% | 5.2% |
| Middle East & Africa | $214 billion | 19.3% | 2.9% |
Asia Pacific dominates with China driving massive volumes. Latin America and MEA show fastest growth.
Top E-commerce Markets by Country
Leading national markets:
- China: $3.2 trillion (43% of global e-commerce)
- United States: $1.3 trillion (17.6%)
- United Kingdom: $289 billion (3.9%)
- Japan: $256 billion (3.5%)
- Germany: $187 billion (2.5%)
- South Korea: $156 billion (2.1%)
- France: $142 billion (1.9%)
- India: $134 billion (1.8%)
Also read about: The Best E-commerce Scrapers in 2026🔥: Which One Wins?
E-commerce Growth Statistics
Online retail expansion continues rapidly. Multiple factors drive growth.
Year-over-Year Growth Rates
Annual expansion metrics:
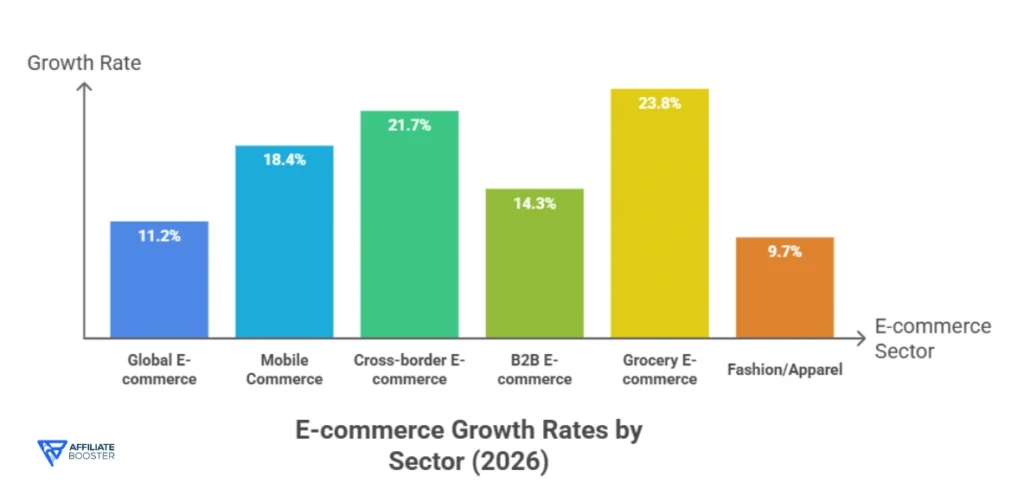
- Global e-commerce growth (2026): 11.2%
- Mobile commerce growth: 18.4%
- Cross-border e-commerce growth: 21.7%
- B2B e-commerce growth: 14.3%
- Grocery e-commerce growth: 23.8%
- Fashion/apparel growth: 9.7%
Historical Growth Trajectory
Five-year progression:
- 2022 sales: $5.8 trillion
- 2023 sales: $6.3 trillion (+8.6%)
- 2024 sales: $6.7 trillion (+6.3%)
- 2025 sales: $6.9 trillion (+3.0% – post-pandemic normalization)
- 2026 sales: $7.4 trillion (+11.2%)
Growth rebounded after pandemic normalization slowdown in 2024-2025.
E-commerce Penetration Rate
Online shopping reaches mainstream:
- Global e-commerce penetration: 23.6% of total retail
- China penetration: 52.1%
- United States penetration: 16.4%
- United Kingdom penetration: 31.3%
- Western Europe average: 18.7%
- Expected global penetration by 2030: 31.2%
Mobile Commerce (M-commerce) Statistics
Smartphones drive e-commerce evolution. Mobile dominates online shopping.
Mobile Shopping Volume
M-commerce metrics reveal dominance:
- Global m-commerce sales (2026): $5.1 trillion
- Mobile share of e-commerce: 68.9%
- Growth rate: 18.4% year-over-year
- Mobile-only shoppers: 1.2 billion globally
- Average mobile transaction: $67
- Mobile conversion rate: 2.8% (versus 4.1% desktop)
Mobile App vs Mobile Web
Shopping method preferences:
| Shopping Method | Transaction Share | Average Order Value | Conversion Rate |
| Mobile App | 54% | $89 | 3.7% |
| Mobile Web | 46% | $58 | 2.1% |
| Desktop | 31.1% | $127 | 4.1% |
Apps outperform mobile web significantly. Desktop maintains higher order values.
Mobile Payment Methods
Payment preferences on mobile:
- Digital wallets: 56% (Apple Pay, Google Pay, PayPal)
- Credit/debit cards: 32%
- Buy Now Pay Later: 8%
- Carrier billing: 2%
- Cryptocurrency: 2%
Digital wallets dominate mobile checkout. Convenience drives adoption.
Consumer Behavior and Shopping Habits
Understanding shopper behavior reveals opportunities.
Online Shopping Frequency
How often consumers shop online:
- Shop online weekly: 47% of consumers
- Shop monthly: 34%
- Shop quarterly: 12%
- Shop rarely/annually: 7%
- Average purchases per shopper annually: 42 transactions
- Average monthly online spend: $220
Product Categories Performance
What sells best online:
| Category | Market Size 2026 | Growth Rate | Online Penetration |
| Fashion & Apparel | $1.2 trillion | 9.7% | 38% |
| Electronics | $987 billion | 8.3% | 42% |
| Food & Beverage | $624 billion | 23.8% | 12% |
| Beauty & Personal Care | $478 billion | 14.2% | 27% |
| Home & Garden | $412 billion | 11.4% | 19% |
| Toys & Hobbies | $287 billion | 13.6% | 34% |
| Books & Media | $234 billion | 6.2% | 67% |
| Health & Wellness | $198 billion | 18.7% | 21% |
Food & beverage shows explosive growth. Books maintain highest penetration.
Shopping Cart Abandonment
Major conversion challenge:
- Average cart abandonment rate: 70.2%
- Mobile abandonment rate: 85.6%
- Desktop abandonment rate: 73.1%
- Tablet abandonment rate: 80.4%
- Value of abandoned carts (2025): $5.2 trillion
- Recoverable abandonment: 63% with proper follow-up
Reasons for Cart Abandonment
Why shoppers don't complete purchases:
- Unexpected shipping costs: 48%
- Required account creation: 24%
- Complicated checkout process: 17%
- Concerns about payment security: 16%
- Long delivery times: 14%
- Website errors/crashes: 13%
- Just browsing/comparing prices: 37%
Demographics and User Statistics
E-commerce adoption varies by demographics.
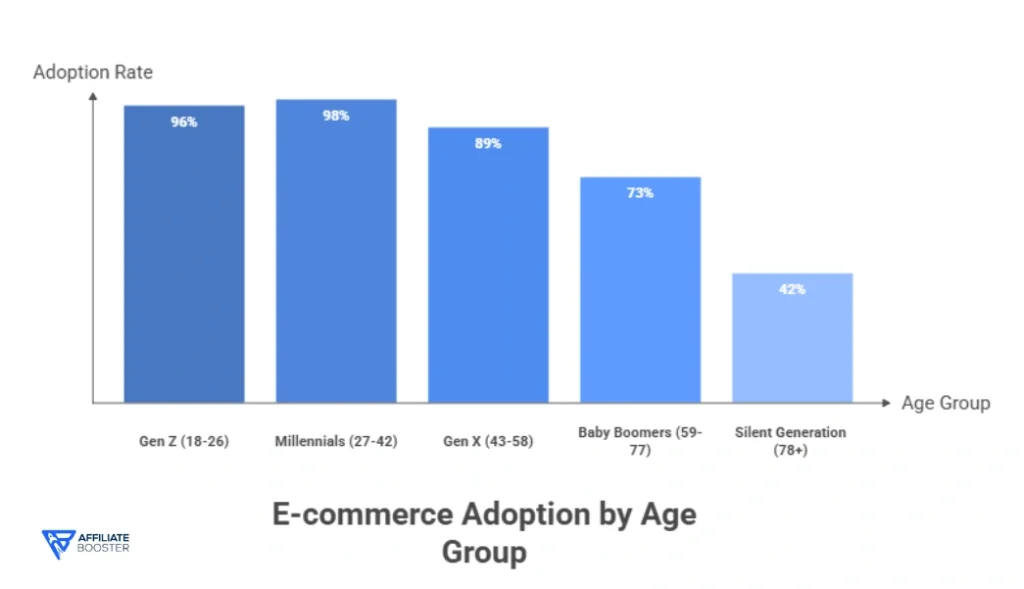
Age Distribution
Shopping habits by generation:
- Gen Z (18-26): 96% shop online, average spend $1,847/year
- Millennials (27-42): 98% shop online, average spend $3,124/year
- Gen X (43-58): 89% shop online, average spend $2,987/year
- Baby Boomers (59-77): 73% shop online, average spend $2,156/year
- Silent Generation (78+): 42% shop online, average spend $1,234/year
Millennials lead in both adoption and spending. Gen Z grows fastest.
Gender Shopping Patterns
Male versus female behavior:
- Female shoppers: 51% of online buyers, average spend $2,834/year
- Male shoppers: 49% of online buyers, average spend $2,447/year
- Women prefer: Fashion, beauty, home goods
- Men prefer: Electronics, automotive, sports equipment
- Women shop more frequently: 47 purchases/year versus men's 37
- Men have higher average order value: $73 versus women's $61
Income Level Impact
Spending correlates with income:
- Household income $100K+: $4,567 average annual spend
- $75K-$100K: $3,234
- $50K-$75K: $2,456
- $35K-$50K: $1,789
- Under $35K: $1,123
- High-income shoppers purchase 2.3x more frequently
Social Commerce Statistics
Social media drives purchasing decisions. Platforms become marketplaces.
Social Shopping Market Size
Social commerce grows explosively:
- Global social commerce sales (2026): $2.1 trillion
- Growth rate: 27.4% year-over-year
- Share of total e-commerce: 28.4%
- Social commerce shoppers: 1.4 billion globally
- Average purchase via social: $87
Platform Performance
Where social shopping happens:
| Platform | Users Shopping | Sales Volume 2026 | Dominant Category |
| TikTok Shop | 780 million | $624 billion | Fashion, beauty |
| Facebook/Instagram | 890 million | $542 billion | Various |
| 340 million | $287 billion | Home, fashion | |
| YouTube Shopping | 420 million | $198 billion | Electronics |
| Snapchat | 156 million | $67 billion | Fashion, beauty |
TikTok Shop dominates growth with integrated shopping experience.
Influencer Marketing Impact
Creator-driven commerce:
- Consumers who purchased via influencer recommendation: 68%
- Average influencer-driven purchase: $134
- Influencer marketing ROI: $5.78 per dollar spent
- Brands using influencer commerce: 79%
- Micro-influencer effectiveness: 87% higher than celebrities
Also read about: Influencer Marketing Statistics
Cross-Border E-commerce
International shopping removes barriers. Global marketplaces thrive.
Cross-Border Market Size
International e-commerce volumes:
- Cross-border e-commerce sales (2026): $1.8 trillion
- Growth rate: 21.7% year-over-year
- Share of total e-commerce: 24.3%
- Cross-border shoppers: 1.1 billion
- Average cross-border transaction: $156
Popular Cross-Border Routes
Major international shopping flows:
- China to USA: $287 billion
- China to Europe: $234 billion
- USA to Canada: $89 billion
- UK to Europe: $67 billion
- Europe to USA: $54 billion
China dominates exports. Western markets import heavily.
Cross-Border Challenges
Barriers to international shopping:
- High shipping costs: Cited by 64% of shoppers
- Long delivery times: 58%
- Customs/import fees: 47%
- Product returns difficulty: 43%
- Currency conversion concerns: 31%
- Language barriers: 28%
Payment Method Statistics
How consumers pay online evolves rapidly.
Payment Preferences
Checkout method distribution:
| Payment Method | Usage Share | Growth Rate | Preferred By |
| Digital Wallets | 49% | +18% | Millennials, Gen Z |
| Credit Cards | 23% | -3% | Gen X, Boomers |
| Debit Cards | 14% | +2% | All demographics |
| Buy Now Pay Later | 8% | +67% | Gen Z, Millennials |
| Bank Transfer | 4% | +12% | Europe, Asia |
| Cash on Delivery | 2% | -8% | Developing markets |
Digital wallets now dominate globally. BNPL grows explosively.
Top Digital Wallet Providers
Leading payment platforms:
- PayPal: 429 million active users globally
- Apple Pay: 507 million users
- Google Pay: 400 million users
- Alipay: 1.3 billion users (China-focused)
- WeChat Pay: 900 million users (China-focused)
Buy Now Pay Later Adoption
Installment payment explosion:
- BNPL transaction volume (2026): $680 billion
- Growth rate: 67% year-over-year
- BNPL users globally: 420 million
- Average BNPL purchase: $187
- Repeat usage rate: 73%
- Default rate: 6.8%
Leading BNPL providers: Klarna, Afterpay, Affirm, PayPal Pay in 4
Conversion Rate Optimization
Improving sales efficiency matters tremendously.
Average Conversion Rates
Industry benchmark metrics:
- Global e-commerce conversion rate: 2.86%
- Desktop conversion rate: 4.14%
- Mobile conversion rate: 2.82%
- Tablet conversion rate: 3.49%
- Top 10% of sites: 11.2%+ conversion rate
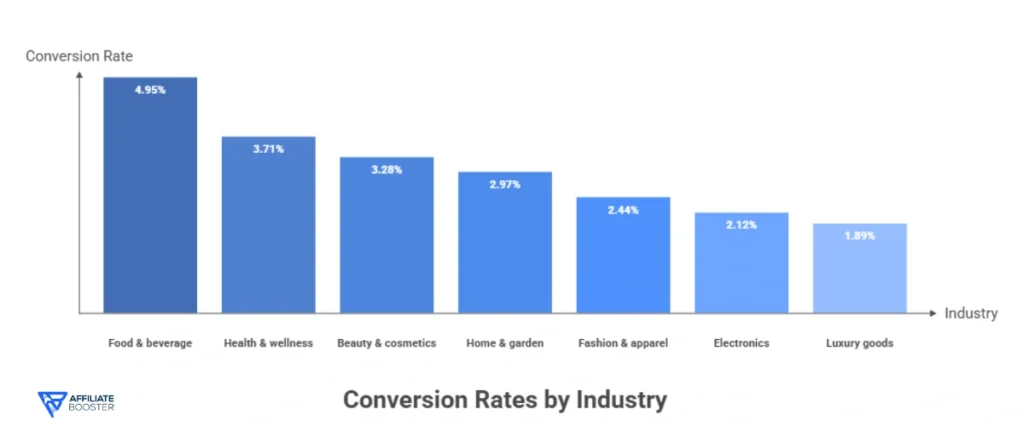
Conversion Rate by Industry
Sector performance varies:
- Food & beverage: 4.95%
- Health & wellness: 3.71%
- Beauty & cosmetics: 3.28%
- Home & garden: 2.97%
- Fashion & apparel: 2.44%
- Electronics: 2.12%
- Luxury goods: 1.89%
Higher-frequency purchases convert better. Luxury requires more consideration.
Factors Impacting Conversion
What drives or kills sales:
Positive Impact:
- Free shipping: +28% conversion
- Customer reviews: +18%
- Live chat support: +12%
- Multiple payment options: +9%
- Clear return policy: +7%
Negative Impact:
- Slow page load (3+ seconds): -32% conversion
- Forced account creation: -24%
- Hidden costs at checkout: -21%
- Poor mobile experience: -18%
Customer Acquisition and Retention
Getting and keeping customers drives profitability.
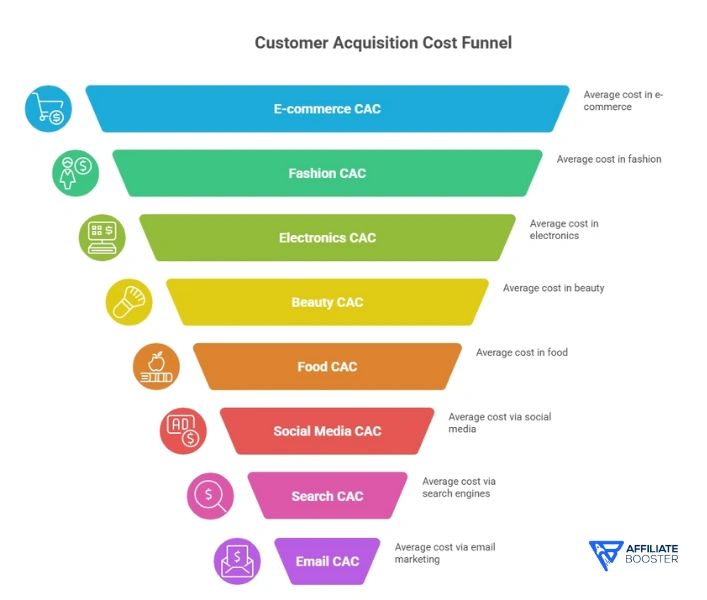
Customer Acquisition Cost (CAC)
Average costs to acquire buyers:
- E-commerce average CAC: $45
- Fashion/apparel: $129
- Electronics: $87
- Beauty/cosmetics: $67
- Food/beverage: $38
- Paid social media CAC: $52
- Paid search CAC: $41
- Email marketing CAC: $12
Customer Lifetime Value
Long-term customer worth:
- Average CLV: $168 (all industries)
- Fashion loyal customer CLV: $478
- Electronics CLV: $387
- Beauty subscription CLV: $562
- CLV:CAC ratio (healthy): 3:1 or higher
- Top performers achieve: 8:1 ratio
Repeat Purchase Rates
Customer loyalty metrics:
- Customers who make repeat purchase: 32%
- Within first 30 days: 18%
- Within 90 days: 44%
- Average orders per customer annually: 3.2
- Repeat customer revenue share: 43%
- Repeat customer profit margin: 67% higher
Shipping and Delivery Statistics
Fulfillment expectations shape shopping behavior.
Shipping Speed Expectations
Consumer delivery preferences:
- Expect free shipping: 80% of shoppers
- Willing to wait 3-5 days for free shipping: 68%
- Will pay for same-day delivery: 23%
- Abandon cart due to shipping costs: 48%
- Consider shipping speed in purchase decision: 76%
Delivery Options Performance
Fulfillment method distribution:
| Delivery Method | Usage Rate | Average Cost | Customer Satisfaction |
| Standard (3-5 days) | 62% | $4.95 | 78% |
| Expedited (2-3 days) | 23% | $12.99 | 84% |
| Next-Day | 9% | $19.99 | 91% |
| Same-Day | 4% | $24.99 | 93% |
| In-Store/Curbside Pickup | 2% | Free | 89% |
Faster delivery correlates with higher satisfaction despite cost.
Free Shipping Impact
Zero-cost delivery drives behavior:
- Shoppers who expect free shipping: 80%
- Minimum purchase for free shipping: Average $50
- Revenue increase with free shipping: +20%
- Cart size increase to qualify: +35%
- Conversion rate lift: +28%
Return and Refund Statistics
Product returns challenge e-commerce profitability.
Return Rate Data
How often products come back:
- Average e-commerce return rate: 20.8%
- Fashion/apparel: 40%
- Electronics: 11%
- Home goods: 18%
- Beauty products: 7%
- Shoes: 45%
- Total returns value (2025): $890 billion
Return Policy Impact
Liberal policies drive sales:
- Shoppers who check return policy before buying: 67%
- Prefer 30+ day return window: 73%
- More likely to buy with free returns: 58%
- Revenue increase with free returns: +15%
- Repeat purchase rate with easy returns: +34%
Return Fraud
Dishonest returns hurt margins:
- Return fraud rate: 10.6% of all returns
- Most common fraud: “Wardrobing” (wearing then returning)
- Annual return fraud cost: $94 billion
- Businesses implementing stricter policies: 64%
Future E-commerce Trends
Emerging technologies reshape online shopping.
Voice Commerce Growth
Shopping via voice assistants:
- Voice commerce sales (2026): $164 billion
- Growth rate: 34% year-over-year
- Voice shoppers: 189 million
- Most purchased via voice: Groceries, household items
- Amazon Alexa dominates: 71% of voice commerce
Augmented Reality (AR) Shopping
Virtual try-on technology:
- Retailers offering AR: 34% (up from 12% in 2023)
- AR product visualization adoption: 67% reduction in returns
- Conversion rate lift with AR: 94%
- Beauty/cosmetics AR usage: 78% of apps
- Furniture AR adoption: 56% of major retailers
AI and Personalization
Artificial intelligence powers experiences:
- Retailers using AI personalization: 81%
- Revenue increase from personalization: 10-30%
- Product recommendation accuracy: 89%
- Chatbot customer service: 85% of interactions
- AI-generated product descriptions: 43% of listings
FAQs About e-Commerce Statistics
Also Read About:
- Apple Music Statistics
- Zoom Statistics
- ChatGPT Statistics
- Perplexity AI Statistics
- Meta AI Users Statistics
Conclusion
E-commerce reached $7.4 trillion in 2026, capturing 23.6% of global retail. Mobile dominates at 68.9% of transactions, while social commerce and BNPL payment methods surge.
Consumer expectations for free shipping, easy returns, and personalized experiences continue rising, driving innovation across the industry.