Something significant happened in enterprise technology between 2024 and 2026. AI moved from something companies experiment with to something they depend on. And at the centre of that shift is a specific technology: AI agents — autonomous systems that can plan, decide, and execute tasks without human input at every step.
The market is exploding. The adoption numbers are striking. And the ROI data is compelling. Here is the complete data picture on AI agents in 2026.
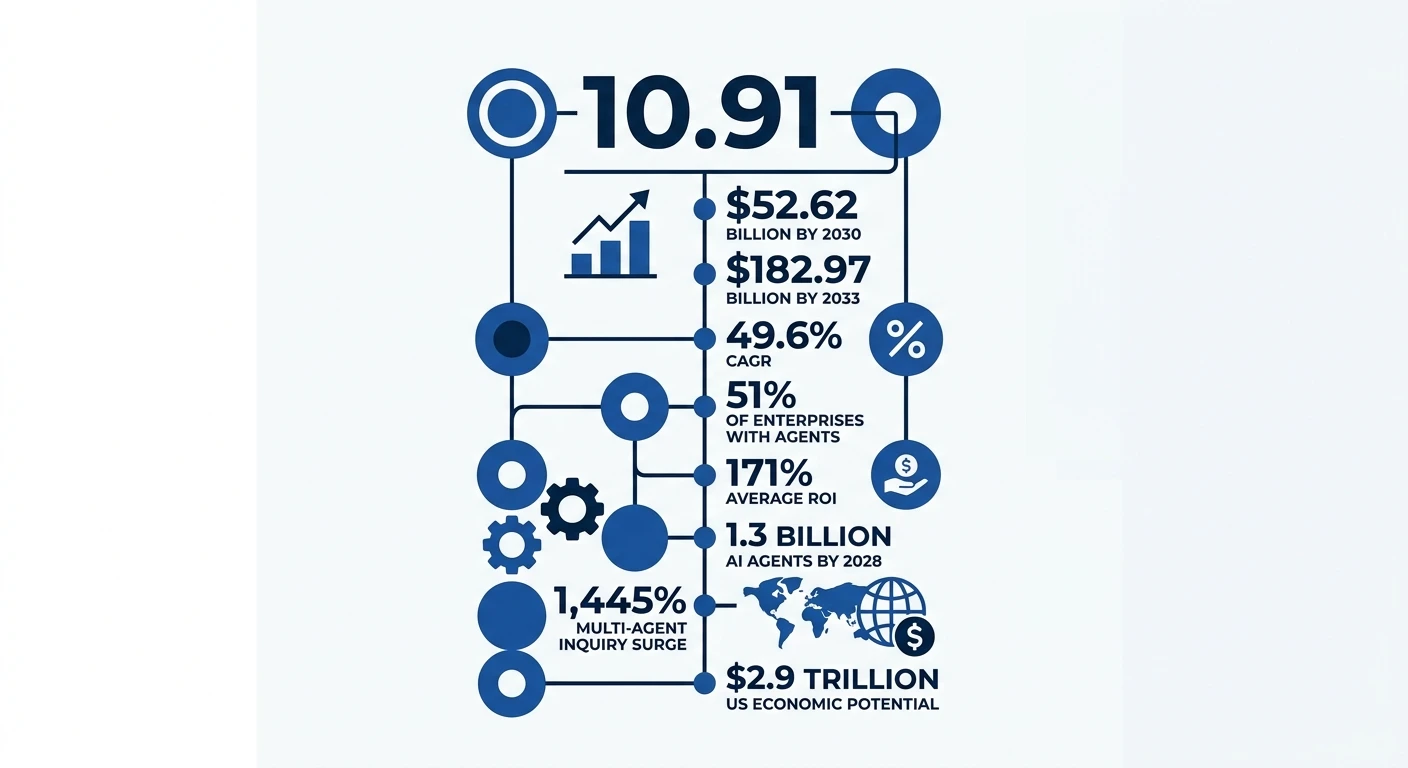
Headline Numbers First
Global AI agents market: $10.91 billion in 2026
Expected market size by 2030: $52.62 billion
Expected by 2033: $182.97 billion
Annual growth rate: 49.6% CAGR
Enterprises with agents in production: 51%
Average expected ROI: 171%
AI agents predicted by 2028: 1.3 billion
Multi-agent system inquiries surged: 1,445% in 14 months
US economic value potential: $2.9 trillion annually
Section 1: Market Size Statistics
The AI agents market has grown at a pace that surprises even industry analysts. In 2024, the market stood at $5.4 billion. By 2025 it crossed $7.63 billion. In 2026 it is expected to reach $10.91 billion — nearly doubling in two years.
Longer-range forecasts point even higher:
Forecast Source | 2030 Projection | 2033 Projection | CAGR |
Grand View Research | — | $182.97B | 49.6% |
MarketsandMarkets | $52.62B | — | 46.3% |
SQ Magazine | $53.2B | — | 44.9% |
DemandSage | $50.31B | — | 45.8% |
Despite slight variations in methodology, all major research firms agree on two things: the market is growing north of 44% annually, and it will cross $50 billion by 2030.
Where the market sits geographically:
North America: 39.63% revenue share — leads globally
Europe: 27% market share
Asia Pacific: 19% — but fastest growing
Middle East and Africa: 4% — smallest but rising
US alone: accounts for 45 of the 67 deployed agentic AI systems indexed globally as of end-2024
By technology type:
Machine learning leads: 30.56% of market
Natural language processing: second and growing fastest
Computer vision: third
By agent system:
Single-agent systems: 59.24% of market (simpler, faster to deploy)
Multi-agent systems: smaller share but growing at a higher rate
Section 2: Enterprise Adoption Statistics
Enterprise adoption has crossed from early-majority into mainstream territory.
Overall Deployment Status
Status | Percentage |
Already have agents in production | 51% |
Planning to deploy within 1-2 years | 35% |
No timeline for adoption | 3% |
Currently experimenting | 39% |
Scaling across the enterprise | 23% |
McKinsey's 2025 State of AI survey (2,000 enterprises, 105 countries) found 62% of organizations at least experimenting with AI agents. LangChain's separate survey found 51% already in production — a substantial number for technology that barely existed three years ago.
85% of enterprises have either implemented or plan to implement AI agents by 2026 (SQ Magazine). Among large enterprises with 10,000 or more employees, more than 80% are already experimenting.
68% of CIOs rank AI agents as a top-3 strategic investment priority in 2026 — above most other technology categories.
Adoption by Department
The functions leading deployment tell you a lot about where the ROI is clearest:
Function | Adoption Rate |
IT (monitoring, automation) | 65%+ |
Customer service | 58% |
Marketing | 51% |
Operations/supply chain | 49% |
Telecom services | 49% |
Insurance workflows | 48% |
Sales | 45% |
Finance (fraud detection, reporting) | 42% |
HR (recruitment, onboarding) | 38–45% |
Product development | 40% |
Legal | 22% |
Customer service adoption at 58% is not surprising — it has clear, measurable benefits like ticket volume reduction and faster resolution times. Legal sits at only 22%, reflecting compliance caution rather than disinterest. That will change as regulation around AI outputs clarifies.
By 2026: 40% of enterprise applications will embed AI agents — up from less than 5% in 2025. This represents one of the fastest feature adoption rates in enterprise software history.
Section 3: Business Impact and ROI Statistics
This is where the data gets most compelling for decision-makers.
ROI and Financial Returns
Metric | Figure |
Companies expecting 100%+ ROI | 62% |
Average anticipated return | 171% |
Three-year ROI range reported | 191–333% |
Revenue growth for AI-agent sales teams | 83% |
Sales ROI increase (McKinsey) | 10–20% |
Marketing cost reduction potential | Up to 37% |
US annual economic value potential | $2.9 trillion |
Customer experience ROI (some deployments) | 128% |
Revenue growth from AI agent adoption | 3–15% |
Operational Improvements
Across industries, companies deploying AI agents are reporting:
Workflow automation handling 60–70% of employee time on repetitive tasks
Customer service cost reduction of 25%
AI-powered virtual assistants handling 60%+ of customer queries without human escalation
48% of consumers reporting improved customer service response times after AI agent deployment
Staff efficiency improvements of 61% in insurance (2026 survey)
Cost reductions of 56% in insurance use cases
Specific Company Examples
Company | Deployment | Result |
Coca-Cola | Content creation agents | 50% less time, 20% higher ROI |
AT&T | Operational workflow agents | 15% cost reduction |
BT Group | Customer interaction agents | 60,000 automated weekly |
Unilever | HR recruitment agents | $1M+ saved, 75% faster hiring |
Salesforce (internal) | Sales agents | 15% larger deals, 25% shorter cycles |
Section 4: Consumer AI Agent Statistics
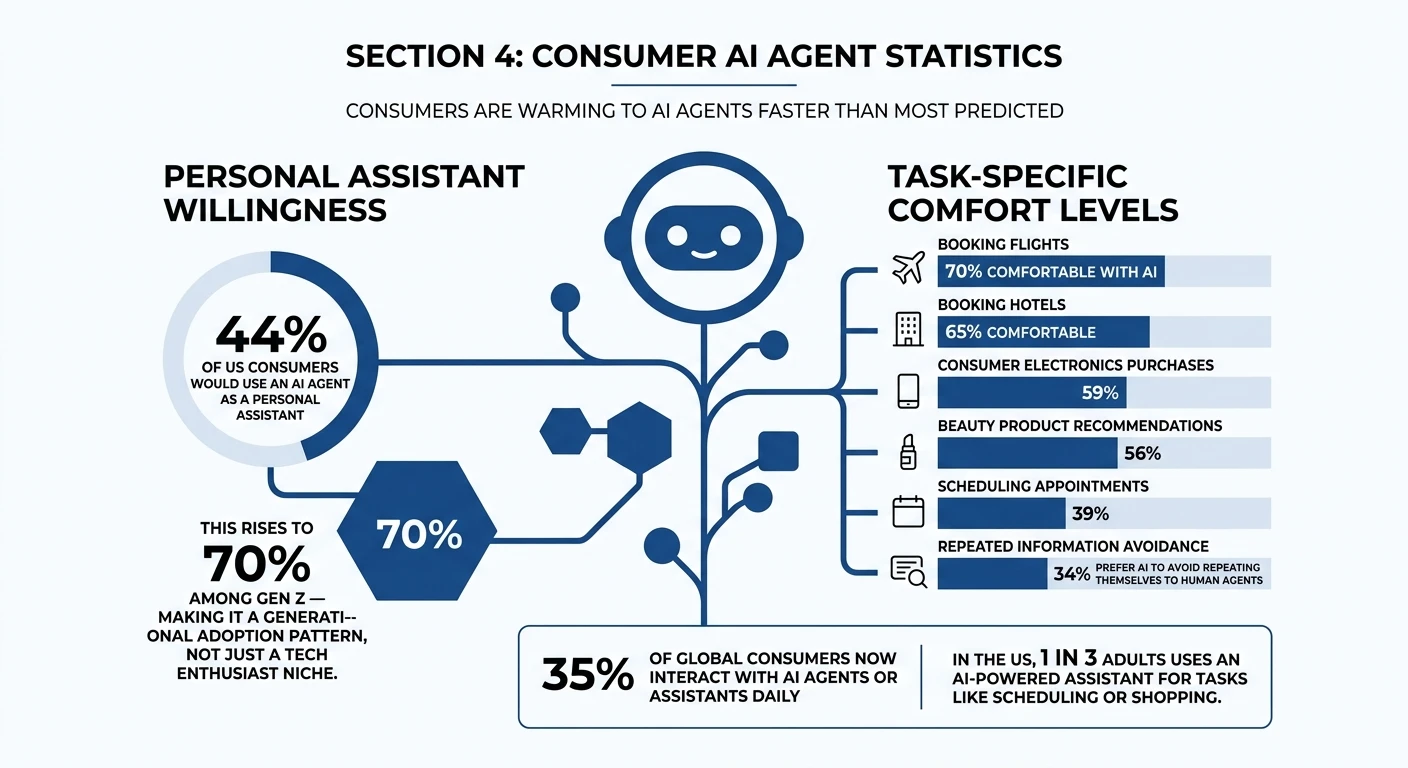
Consumers are warming to AI agents faster than most predicted.
Personal assistant willingness:
44% of US consumers would use an AI agent as a personal assistant
This rises to 70% among Gen Z — making it a generational adoption pattern, not just a tech enthusiast niche
Task-specific comfort levels:
Booking flights: 70% comfortable with AI
Booking hotels: 65% comfortable
Consumer electronics purchases: 59%
Beauty product recommendations: 56%
Scheduling appointments: 39%
Repeated information avoidance: 34% prefer AI to avoid repeating themselves to human agents
35% of global consumers now interact with AI agents or assistants daily. In the US, 1 in 3 adults uses an AI-powered assistant for tasks like scheduling or shopping.
Section 5: Developer and Platform Statistics
The technical ecosystem around AI agents has grown explosively.
Open-source frameworks (GitHub activity):
Framework | Stars | Forks |
AutoGPT | 178,000 | 46,000 |
LangChain | 115,000 | 18,800 |
AgentGPT | 34,900 | 9,500 |
BabyAGI | 21,800 | 2,800 |
The growth in open-source AI agent frameworks shows where developer interest is concentrated. LangChain in particular has become the dominant framework for building multi-agent systems in enterprise environments.
Multi-agent inquiries: Increased 1,445% from Q1 2024 to Q2 2025 — the single most dramatic adoption signal in the entire AI agents ecosystem.
Section 6: Risk and Governance Statistics
Growth this fast brings governance challenges.
Only 21% of companies have a mature governance model for autonomous AI agents
29% of employees already use unsanctioned AI agents for work
74% of CEOs cite data security as their primary AI concern
38% of employees share sensitive information with AI without informing their employer
Fragmented AI laws expected to cover 50% of world economies by 2027
Estimated compliance spending: $5 billion by 2027
Gartner expects 2,000+ “death by AI” claims by end of 2026 tied to autonomous system failures
Section 7: Future Projections
Milestone | Expected Timing |
1.3 billion AI agents globally | 2028 (Microsoft) |
33% of enterprise software includes agentic AI | 2028 |
50% of GenAI companies running agentic pilots | 2027 |
One-third of GenAI interactions involve agents | 2028 |
AI agents outnumber human sellers by 10x | 2028 |
60% of brands using agents for 1-to-1 interactions | 2028 |
AI agents market reaches $221 billion | 2035 |
Conclusion
The AI agents market is not approaching a tipping point — it has already passed one. With 51% of enterprises in production deployment, a 49.6% annual growth rate, and an ROI profile that most enterprise technologies never achieve, the adoption curve is steep and accelerating.
The governance gap is the biggest challenge ahead. Fast adoption without mature oversight is creating shadow AI deployments and compliance risks that will only grow as agent autonomy increases.
For businesses watching from the sidelines, the data suggests the cost of waiting is rising. The companies deploying now are compounding advantages every quarter.
FAQs
The AI agents market is projected to reach $10.91 billion in 2026, up from $7.63 billion in 2025. By 2030, the market is forecast to hit $52.62 billion, growing at a CAGR of 46.3%.
51% of enterprises already have AI agents running in production environments as of 2026. An additional 23% are actively scaling them, and 85% of enterprises have either implemented or plan to implement AI agents by the end of 2026.
Yes, Microsoft projects there will be 1.3 billion AI agents by 2028. Barclays estimates an even wider range of between 1.5 and 22 billion when micro-deployments are included in the count.
AI agents can generate up to $2.9 trillion annually in business value in the US alone. Companies deploying them report 3–15% revenue growth and 10–20% increases in sales ROI.
Salesforce Agentforce currently leads the AI agents platform market, scoring highest across technical, operational, and governance metrics. Other major competing platforms include Google Cloud, Microsoft Azure, AWS, and IBM Watson.