Immigration continues to shape the United States more than almost any other demographic force.
In 2026, the country remains the world’s largest destination for immigrants, with tens of millions of foreign-born residents contributing to population growth, labor markets, and economic output.
At the same time, immigration policy has become stricter, deportations have increased, and voluntary exits have risen.
These changes have slowed growth in the foreign-born population for the first time in decades.
This blog breaks down the latest US immigration statistics, explains what they mean, and explores what may come next.
Overview: US Immigration at a Glance
Immigration in the US has reached historic levels, even as enforcement has intensified.
Key Highlights
- 51.9 million immigrants lived in the US in mid-2025
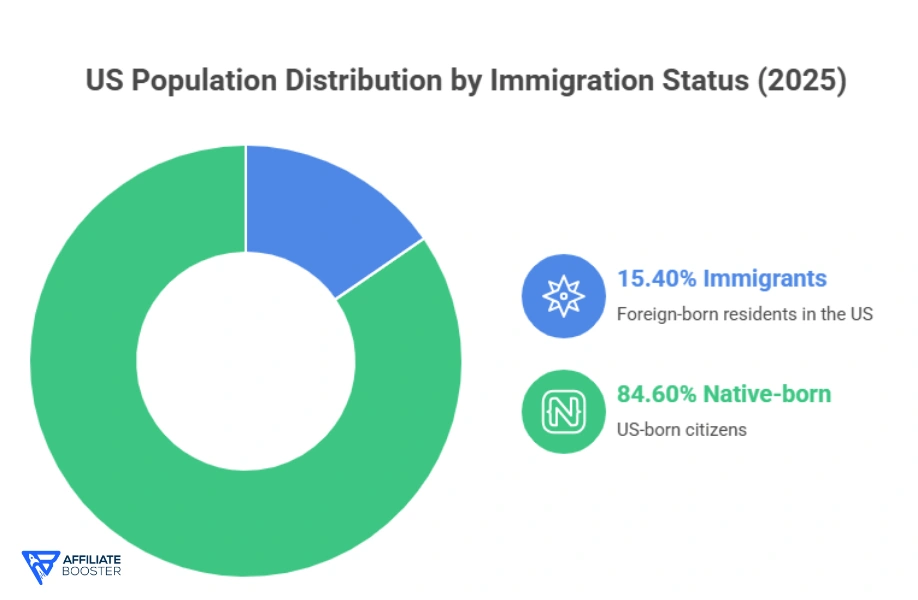
- Immigrants made up 15.4% of the total population
- 14 million unauthorised immigrants lived in the US in 2023
- ICE deported 271,000 people in 2024, the highest since 2014
- Over 2 million immigrants left the US in 2025, many voluntarily
- Immigration is projected to add $8.9 trillion to US GDP from 2024–2034
Despite recent declines, the long-term trend still shows strong growth driven by economic demand, global instability, and family-based migration.
HHow Many Immigrants Live in the United States?
As of June 2025, the United States had 51.9 million foreign-born residents.
At the start of 2025, this number stood at 53.3 million, or 15.8% of the population, the highest share ever recorded.
The small decline reflects:
- Higher deportations
- Increased voluntary departures
- Slower arrivals due to stricter border controls
This marked the first notable drop in more than 50 years.
Historical Growth Perspective
Since 1850, the US immigrant population has increased by more than 2,000%. Even with recent declines, the US remains ahead of other major destinations.
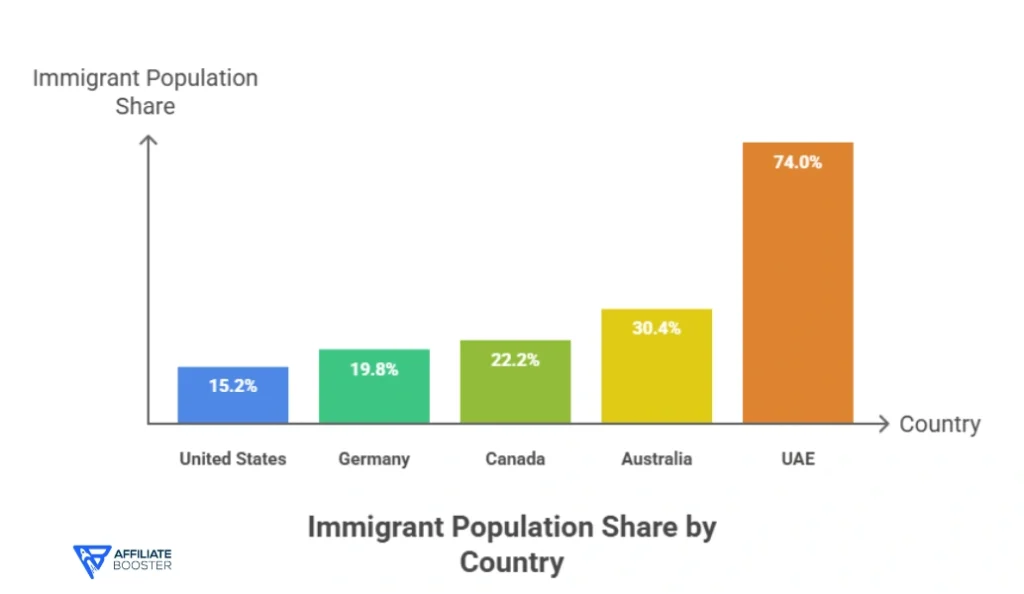
Comparison With Other Countries
| Country | Immigrant Population Share |
| United States | 15.2% |
| Germany | 19.8% |
| Canada | 22.2% |
| Australia | 30.4% |
| UAE | 74.0% |
US Immigrant Population by Year
Immigration growth has been steady for decades.
| Year | Number of Immigrants |
| 2023 | 47.8 million |
| 2020 | 45.0 million |
| 2010 | 39.9 million |
| 2000 | 31.1 million |
| 1980 | 14.1 million |
| 1950 | 10.3 million |
| 1850 | 2.2 million |
Key insight:
Even periods of restriction rarely reverse immigration trends. They mostly slow them.
Unauthorised Immigration in the US
In 2023, the US had 14 million unauthorised immigrants, the highest number ever recorded.
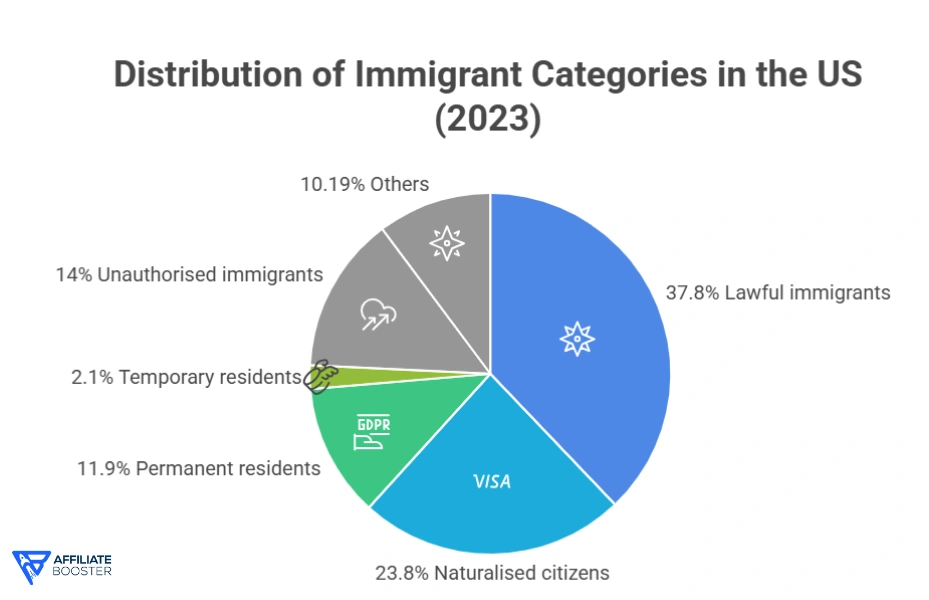
Breakdown of Legal Status (2023)
| Category | Population (millions) | Share |
| Lawful immigrants | 37.8 | 73% |
| Naturalised citizens | 23.8 | 46% |
| Permanent residents | 11.9 | 23% |
| Temporary residents | 2.1 | 4% |
| Unauthorised immigrants | 14.0 | 27% |
Nearly half of all immigrants are now US citizens, showing long-term settlement and integration.
Deportations and Immigration Enforcement Trends
Immigration enforcement has risen sharply in recent years.
Key Enforcement Facts
- 271,484 deportations in FY 2024
- Highest annual total since 2014
- Over 2 million immigrants left the US in 2025, many self-deporting
Deportations by Administration (Selected)
| President | Enforcement Actions |
| Clinton | 12.2 million |
| Bush (Jr.) | 10.3 million |
| Obama | 5.3 million |
| Trump (1st term) | 267,000 in 2019 |
Important note:
Older figures include both removals and voluntary returns, making direct comparisons difficult.
ICE Detention and Removal Activity
ICE detention numbers remain high.
ICE Detention Snapshot (2025)
- 46,015 people in ICE detention
- 66,000 total detainees at peak levels
- Over 8,800 immigration flights in 2025
This shows a shift toward faster processing and removals, rather than long-term detention.
Immigrant Demographics in the US
Immigrants play a central role in the US labor force.
Age Distribution
| Age Group | Foreign-Born | US-Born |
| 0–15 | 4.9% | 21.4% |
| 16–64 | 77.1% | 60.9% |
| 65+ | 18.0% | 17.7% |
Most immigrants are working age, making them critical to economic stability.
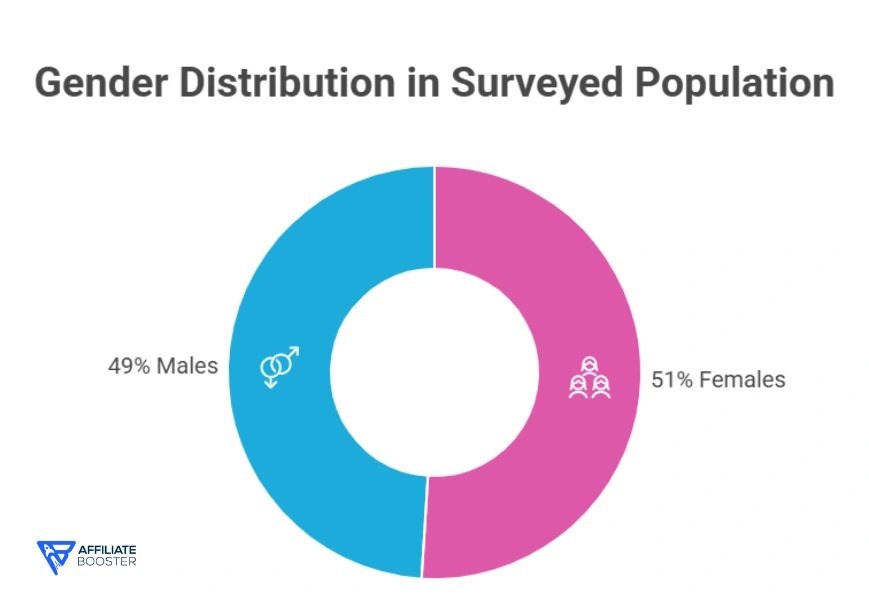
Gender Split
- 51% female
- 49% male
Top Countries of Origin
| Country | Share of Immigrants |
| Mexico | 22.8% |
| India | 6.1% |
| China | 4.6% |
| Philippines | 4.3% |
| El Salvador | 3.1% |
| Others | 59.1% |
New trend:
India is now the fastest-growing source of skilled immigrants, especially in tech, healthcare, and finance.
Economic Impact of Immigration
Immigration is a major driver of economic growth.
Economic Contributions
- $8.9 trillion GDP boost (2024–2034)
- $1.2 trillion in added federal revenue
- $167 billion more per year by 2034
Immigrants also support key sectors:
- Healthcare
- Construction
- Technology
- Agriculture
- Gig economy
New Insight: Remote Work Effect
With 27.5% of Americans working remotely in 2025, immigrants now access jobs beyond local markets. This benefits:
- Skilled migrants
- Rural employers
- Startups with limited hiring pools
Policy Risks and Future Challenges (Exclusive Analysis)
While immigration boosts growth, restrictive policies carry risks.
Projected Impact of Tight Restrictions
- Workforce reduction of 6.8 million by 2028
- Loss of 15.7 million workers by 2035
- GDP reduction of $12.1 trillion by 2035
This could worsen:
- Labor shortages
- Inflation pressures
- Federal debt levels
What Comes Next for US Immigration?
Key Trends to Watch
- Slower growth, not reversal
- More enforcement-focused policy
- Rising skilled and remote migration
- Higher naturalisation rates
Immigration will remain a central force in shaping America’s economy, workforce, and demographics through 2030 and beyond.
FAQs About US Immigration Statistics
Also Read:
- Average US Income & Salary by State In 2026
- iPhone User Statistics
- X (Twitter) Statistics
- Google Gemini Statistics
- 10+ CRM Statistics & Trends
Final Thoughts
US immigration in 2026 reflects a country at a crossroads. The numbers show both historic scale and rising pressure.
Immigrants remain essential to economic growth, innovation, and labor supply. At the same time, enforcement-heavy approaches risk long-term economic costs.
The future of US immigration will depend on balance—between security and opportunity, enforcement and integration, and short-term politics versus long-term prosperity.
If current trends continue, immigration will not just shape America’s population. It will define its economic future.
Source: Wikipedia, American Immigration Council