TikTok has conquered social media globally. The platform transformed how people create and consume content.
This comprehensive guide covers TikTok statistics for 2026. You'll discover user counts, engagement rates, and revenue insights.
Let's examine the numbers behind this viral phenomenon.
TikTok User Statistics
TikTok's user base continues explosive growth. The platform reaches billions worldwide.
Global User Count
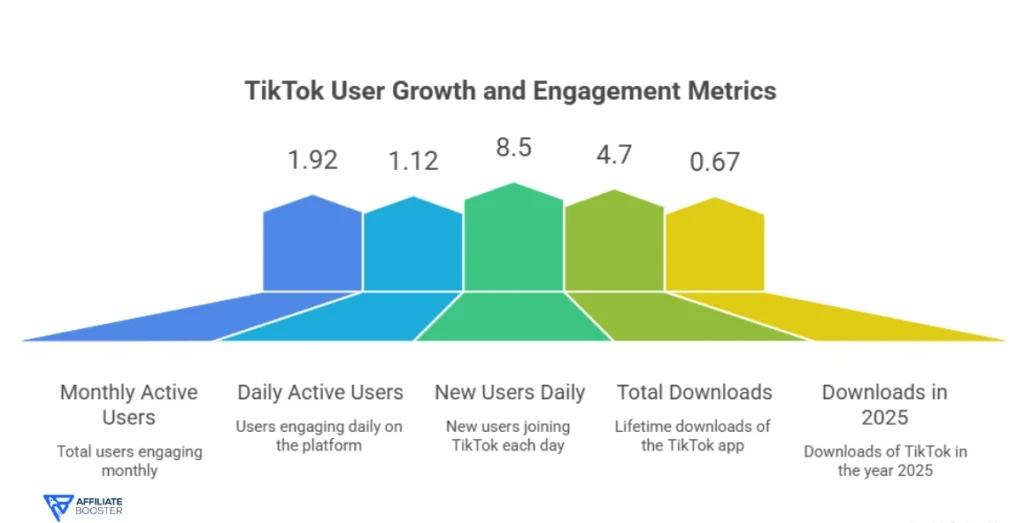
TikTok user metrics reveal massive scale:
- Total monthly active users (2026): 1.92 billion
- Growth from 2025: +14.3%
- Daily active users: 1.12 billion
- New users joining daily: 8.5 million
- Total downloads (lifetime): 4.7 billion
- Downloads in 2025: 670 million
Historical User Growth
Five-year trajectory shows acceleration:
- 2022: 1.05 billion monthly active users
- 2023: 1.35 billion (+28.6%)
- 2024: 1.56 billion (+15.6%)
- 2025: 1.68 billion (+7.7%)
- 2026: 1.92 billion (+14.3%)
Growth rebounded after brief slowdown. Platform expansion continues strong.
Regional User Distribution
Geographic breakdown reveals patterns:
| Region | Users (Millions) | Percentage | Growth Rate |
| Asia Pacific | 1,124 | 58.5% | 16.2% |
| North America | 192 | 10.0% | 8.4% |
| Europe | 289 | 15.1% | 11.7% |
| Latin America | 187 | 9.7% | 19.8% |
| Middle East & Africa | 128 | 6.7% | 23.4% |
Asia Pacific dominates user count. Emerging markets show fastest growth.
Top Countries by User Count
Leading national markets:
- United States: 148 million users
- Indonesia: 126 million users
- Brazil: 103 million users
- Vietnam: 87 million users
- Mexico: 78 million users
- Philippines: 71 million users
- Pakistan: 64 million users
- Thailand: 58 million users
Note: China uses Douyin (TikTok's sister app) instead.
Also read about: Social Media Statistics
Demographics and User Profile
Understanding TikTok's audience reveals targeting opportunities.
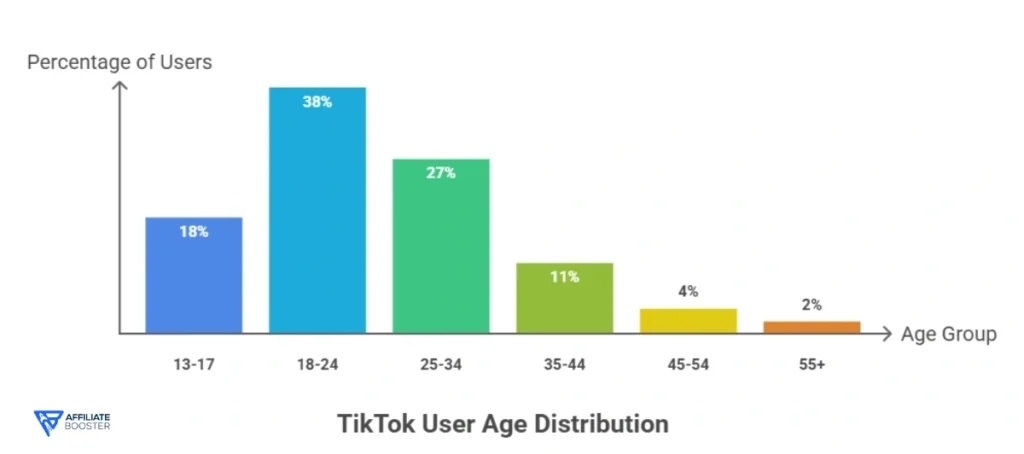
Age Distribution
User breakdown by generation:
| Age Group | Percentage | Total Users (Millions) | Most Active |
| 13-17 | 18% | 346 | High engagement |
| 18-24 | 38% | 730 | Highest usage |
| 25-34 | 27% | 518 | Growing segment |
| 35-44 | 11% | 211 | Fastest growth |
| 45-54 | 4% | 77 | Emerging |
| 55+ | 2% | 38 | Small but growing |
18-24 demographic dominates platform. Older audiences growing rapidly.
Gender Distribution
Male versus female users:
- Female users: 57% (1.09 billion)
- Male users: 43% (826 million)
- Women spend 14% more time on platform
- Men prefer gaming and sports content
- Women engage more with beauty, fashion, lifestyle
- Non-binary representation: Growing but unmeasured
Income and Education
User socioeconomic profile:
- College educated: 64% of US users
- Household income $100K+: 42%
- Household income $50K-$100K: 38%
- Below $50K: 20%
- Urban users: 67%
- Suburban users: 28%
- Rural users: 5%
TikTok reaches affluent, educated audiences despite youth perception.
Also read about: Instagram Reels Statistics
Engagement and Usage Statistics
TikTok drives unmatched engagement. Users spend significant time daily.
Daily Time Spent
Average usage duration:
- Average daily time on TikTok: 58 minutes
- Gen Z daily usage: 73 minutes
- Millennial daily usage: 52 minutes
- Gen X daily usage: 34 minutes
- Monthly time spent: 29 hours per user
- Sessions per day: 8.7 times
- Average session length: 10.8 minutes
TikTok engagement exceeds most competitors significantly.
Content Consumption Patterns
What users watch:
- Videos watched per session: 34 videos
- Daily videos viewed per user: 295
- Average video completion rate: 89%
- Videos watched to end: 67%
- Videos rewatched: 34%
- Share rate: 12% of videos watched
High completion rates demonstrate engaging content.
User Activity Breakdown
How people engage:
| Activity | Percentage of Users | Frequency |
| Watching videos | 98% | Daily |
| Liking content | 84% | Multiple times daily |
| Commenting | 47% | Weekly |
| Sharing | 56% | Weekly |
| Creating content | 23% | Monthly |
| Live streaming | 8% | Occasionally |
Most users consume passively. Creators represent minority.
Peak Usage Times
When engagement peaks:
- Highest traffic: 7 PM – 11 PM (local time)
- Weekend usage: +23% versus weekdays
- Lunch hour spike: 12 PM – 1 PM
- Morning commute: 7 AM – 9 AM
- Lowest activity: 3 AM – 6 AM
Evening primetime dominates engagement.
Also read about: YouTube Shorts Statistics
TikTok Revenue and Business Statistics
TikTok generates massive revenue. Monetization accelerates rapidly.
Total Revenue
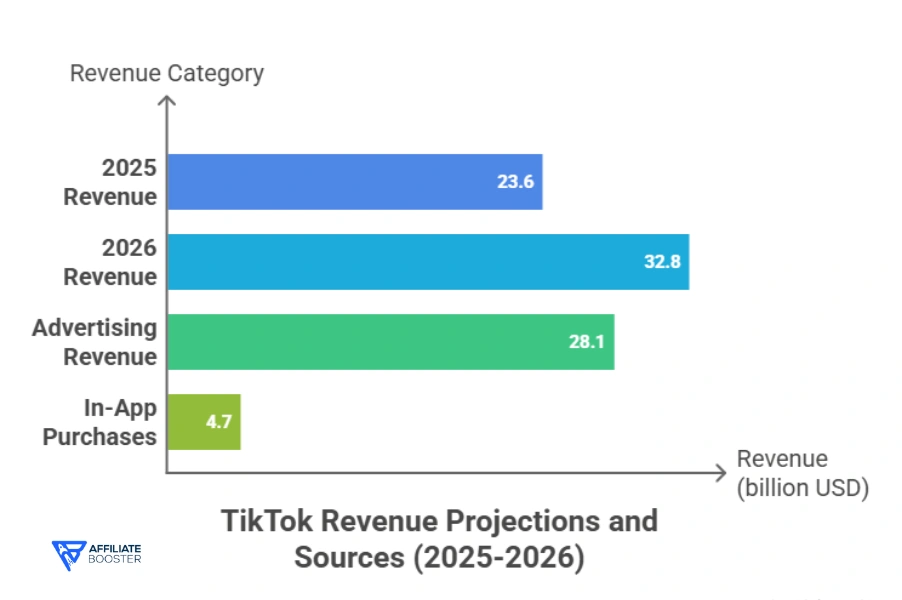
Financial performance metrics:
- TikTok revenue (2025): $23.6 billion
- Projected revenue (2026): $32.8 billion
- Growth rate: +39.0%
- Revenue from advertising: $28.1 billion (86%)
- Revenue from in-app purchases: $4.7 billion (14%)
- Average revenue per user: $17.08
Revenue by Region
Geographic revenue distribution:
- United States: $13.4 billion (41%)
- Europe: $8.2 billion (25%)
- Asia Pacific (ex-China): $7.9 billion (24%)
- Rest of World: $3.3 billion (10%)
US generates disproportionate revenue despite smaller user base.
Advertising Statistics
Ad platform performance:
- Advertisers on TikTok: 8.7 million businesses
- Ad spend growth: +42% year-over-year
- Average CPM (cost per thousand): $9.40
- Average CPC (cost per click): $1.23
- Average CTR (click-through rate): 2.89%
- Video completion rate for ads: 76%
TikTok ads outperform industry averages significantly.
Creator Economy
Monetization for content creators:
- Creator Fund payouts (2025): $2.8 billion
- Creators earning money: 4.2 million
- Average earnings (active creators): $667 monthly
- Top 1% creator earnings: $50,000+ monthly
- Live gift revenue: $3.1 billion annually
- Brand partnership market: $5.7 billion
Creator economy thrives despite payment challenges.
Content Creation Statistics
Understanding what works drives success.
Content Upload Volume
Daily creation metrics:
- Videos uploaded daily: 167 million
- Total videos on platform: Over 1 trillion (estimated)
- Average video length: 34 seconds
- Videos under 15 seconds: 42%
- Videos 15-60 seconds: 47%
- Videos over 60 seconds: 11%
Short-form content dominates platform.
Most Popular Content Categories
What performs best:
| Category | Views (Billions/Month) | Engagement Rate | Creator Count |
| Dance/Challenges | 487 | 8.9% | 28M |
| Comedy/Memes | 456 | 7.8% | 34M |
| Beauty/Fashion | 389 | 9.2% | 19M |
| Food/Cooking | 312 | 8.1% | 15M |
| Education/Tutorials | 267 | 6.4% | 12M |
| Gaming | 234 | 7.2% | 18M |
| Fitness/Wellness | 198 | 8.7% | 9M |
| Animals/Pets | 187 | 10.1% | 7M |
Entertainment categories lead. Educational content grows rapidly.
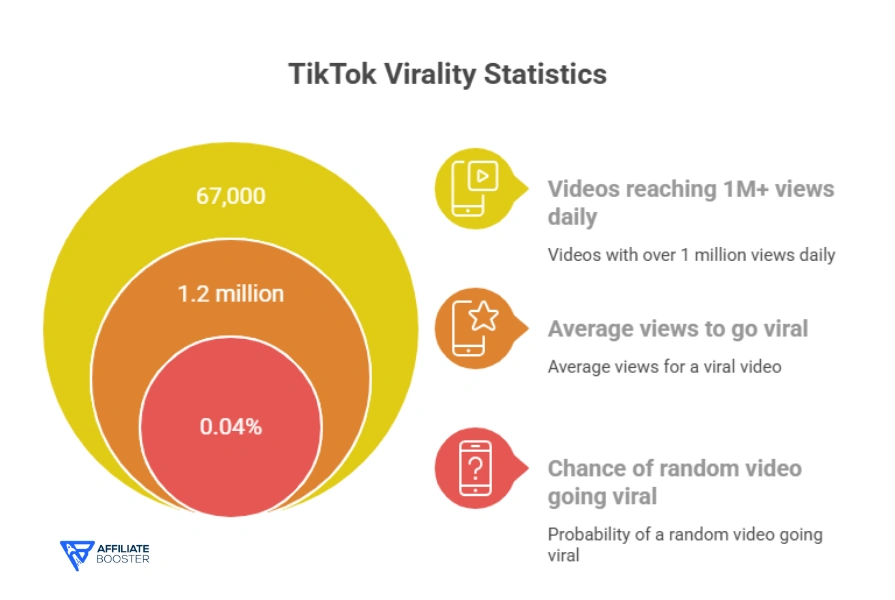
Viral Content Statistics
Going viral on TikTok:
- Videos reaching 1M+ views daily: 67,000
- Average views to go viral: 1.2 million
- Chance of random video going viral: 0.04%
- Optimal posting times: 7-9 PM local time
- First-hour performance predicts virality: 89% accuracy
- Videos using trending sounds: 3.4x more likely to go viral
Hashtag Performance
Hashtag usage and impact:
- Most-viewed hashtag ever: #fyp (2.1 trillion views)
- Average hashtags per video: 4.2
- Optimal hashtag count: 3-5 hashtags
- Branded hashtag challenges: Average 8.5 billion views
- Trending hashtags daily: 150+ per region
Also read about: X (Twitter) Statistics
TikTok Shop and E-commerce
Social commerce transforms TikTok monetization.
TikTok Shop Statistics
Shopping feature performance:
- TikTok Shop GMV (2025): $49.7 billion
- Projected GMV (2026): $84.3 billion
- Growth rate: +69.6%
- Active TikTok Shop merchants: 6.7 million
- Products available: 340+ million
- Countries with TikTok Shop: 23 markets
TikTok Shop explodes into major e-commerce platform.
Shopping Behavior
User purchasing patterns:
- Users who purchased via TikTok: 42%
- Average order value: $67
- Conversion rate: 8.4% (industry-leading)
- Impulse purchases: 71% of transactions
- Product discovery via TikTok: 64% of Gen Z
- Repeat purchase rate: 38%
Top Selling Categories
What sells best:
- Beauty & cosmetics: 32% of sales
- Fashion & apparel: 27%
- Home & living: 14%
- Electronics: 11%
- Food & beverage: 8%
- Health & wellness: 5%
- Other: 3%
Beauty and fashion dominate social shopping.
Live Shopping Performance
Live commerce drives sales:
- Live shopping sessions daily: 234,000
- Average live session viewers: 1,847
- Live commerce conversion rate: 14.2%
- Total live shopping GMV: $27.8 billion
- Top live sellers earn: $500K+ monthly
Live shopping outperforms static product pages.
TikTok vs Competitors
How TikTok compares to other platforms.
User Comparison
Platform size rankings:
| Platform | Monthly Active Users | Daily Active Users | YoY Growth |
| 3.05 billion | 2.11 billion | +2.8% | |
| YouTube | 2.70 billion | 1.89 billion | +4.2% |
| 2.04 billion | 1.28 billion | +6.7% | |
| TikTok | 1.92 billion | 1.12 billion | +14.3% |
| Snapchat | 750 million | 432 million | +9.1% |
| Twitter/X | 611 million | 254 million | -3.2% |
TikTok ranks fourth but shows strongest growth.
Engagement Comparison
Time spent metrics:
- TikTok average daily time: 58 minutes
- Instagram: 51 minutes
- Snapchat: 38 minutes
- Facebook: 34 minutes
- Twitter/X: 31 minutes
- YouTube: 48 minutes (different use case)
TikTok leads engagement among social platforms.
Creator Earnings Comparison
Monetization opportunities:
- TikTok Creator Fund: $0.02-$0.04 per 1,000 views
- YouTube Partner Program: $3-$5 per 1,000 views
- Instagram Reels Bonuses: $0.01-$0.02 per 1,000 views
- TikTok live gifts: More lucrative than ad revenue
YouTube pays creators significantly more per view.
Influencer Marketing on TikTok
Brands invest heavily in TikTok creators.
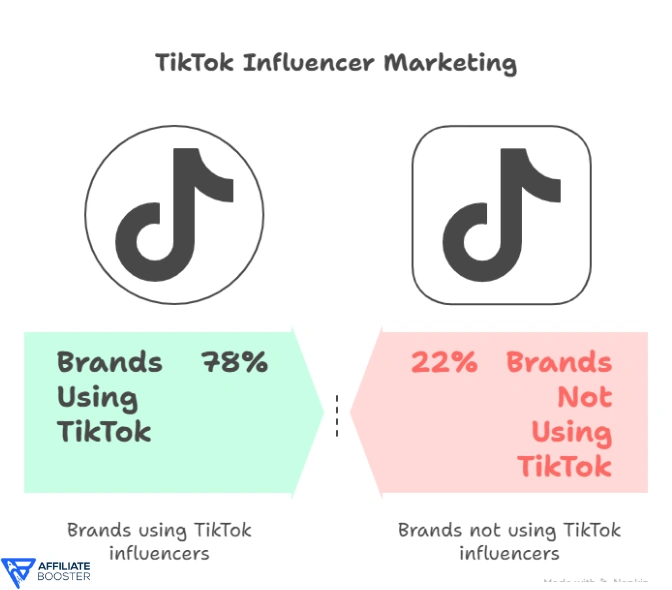
Influencer Marketing Market
Industry size and growth:
- TikTok influencer marketing spend (2026): $8.4 billion
- Growth rate: +34% year-over-year
- Brands using TikTok influencers: 78%
- Average campaign ROI: $6.50 per dollar spent
- Engagement rate (all influencers): 5.96%
TikTok delivers highest engagement rates across platforms.
Influencer Tiers and Pricing
Creator costs by follower count:
| Influencer Type | Followers | Cost Per Post | Engagement Rate |
| Nano | 1K-10K | $5-$25 | 9.7% |
| Micro | 10K-100K | $25-$250 | 7.2% |
| Mid-Tier | 100K-500K | $250-$2,500 | 5.8% |
| Macro | 500K-1M | $2,500-$10,000 | 4.3% |
| Mega | 1M+ | $10,000-$200,000+ | 3.1% |
Smaller influencers deliver better engagement rates.
Campaign Performance
Marketing effectiveness metrics:
- Average campaign reach: 4.7 million impressions
- Average engagement: 278,000 interactions
- Click-through rate: 3.4%
- Conversion rate: 2.8%
- Brand awareness lift: +27%
- Purchase intent increase: +19%
Algorithm and Discovery
Understanding TikTok's recommendation system.
For You Page (FYP) Statistics
Personalized feed performance:
- Content discovery via FYP: 93%
- Average FYP refresh rate: 8 times daily
- Videos shown before repetition: 200-500
- FYP accuracy rating: 87% user satisfaction
- Time to personalization: Under 1 hour for new accounts
Algorithm Factors
What drives visibility:
- Video completion rate: Most important (weighted 40%)
- Shares: High weight (25%)
- Comments: Medium-high weight (15%)
- Likes: Medium weight (10%)
- Watch time: Medium weight (10%)
Completion rate matters more than follower count.
Discovery Methods
How users find content:
- For You Page: 93%
- Following feed: 38%
- Search: 23%
- Hashtags: 19%
- Sounds/audio: 16%
- Direct shares: 14%
FYP dominates content discovery dramatically.
TikTok Advertising Metrics
Platform offers powerful ad opportunities.
Ad Format Performance
Different ad types effectiveness:
| Ad Format | Average CTR | Average CPC | View Rate |
| In-Feed Ads | 2.89% | $1.23 | 76% |
| TopView Ads | 4.67% | $2.14 | 94% |
| Branded Hashtag | 5.12% | N/A | 87% |
| Branded Effects | 6.34% | N/A | 91% |
| Spark Ads | 7.21% | $0.89 | 84% |
Spark Ads (boosted organic content) perform best.
Advertising Costs
TikTok ad pricing:
- Minimum daily budget: $20
- Minimum campaign budget: $50
- Average CPM: $9.40
- Average CPC: $1.23
- Average CPV (cost per view): $0.10
- TopView ad cost: $50,000 per day (reserved)
More affordable than Facebook for many verticals.
Privacy and Safety Statistics
Platform faces regulatory scrutiny.
Security Concerns
User worry metrics:
- Concerned about data privacy: 67% of US users
- Trust TikTok with data: 34%
- Read privacy policy: Only 12%
- Use privacy settings: 41%
- Aware of China ownership: 78%
Privacy concerns persist despite platform popularity.
Safety Features Usage
Protection tool adoption:
- Accounts set to private: 23%
- Comments filtered: 56%
- Screen time limits set: 14%
- Restricted mode enabled: 31%
- Family pairing used: 8% of teen accounts
Many safety features underutilized.
Content Moderation
Platform enforcement statistics:
- Videos removed (Q4 2025): 178 million (1.2% of uploads)
- Accounts banned: 47 million (2.4% of users)
- Average review time: 47 seconds
- AI-detected violations: 92%
- Human moderators: 40,000+ globally
Future Growth Projections
TikTok trajectory continues upward.
User Growth Forecast
Expected expansion:
- 2027 projection: 2.15 billion users
- 2028 projection: 2.39 billion users
- 2030 projection: 2.71 billion users
- Compound annual growth rate: 12.3%
Platform may surpass Instagram by 2028.
Revenue Projections
Financial forecasts:
- 2027 revenue: $45.2 billion
- 2028 revenue: $58.7 billion
- 2030 revenue: $89.3 billion
- E-commerce GMV 2028: $157 billion
TikTok becomes a major economic force.
FAQs About TikTok Statistics
Also Read About:
- Apple Music Statistics
- Zoom Statistics
- ChatGPT Statistics
- Perplexity AI Statistics
- Meta AI Users Statistics
Conclusion
TikTok reached 1.92 billion users in 2026, generating $32.8 billion in revenue.
The platform dominates engagement with 58 minutes daily usage and leads social commerce at $84.3 billion GMV.
Despite privacy concerns, growth continues at 14.3% annually across all demographics globally.
Source: Statista, Business Of Apps