Stripe has revolutionized online payments. The company powers millions of businesses worldwide.
This guide covers comprehensive Stripe statistics for 2026. You'll discover user counts, transaction volumes, and revenue insights.
Let's examine the numbers behind this payment giant.
Stripe Company Overview
Stripe dominates the digital payment landscape. The platform continues expanding globally.
Market Valuation and Financial Performance
Stripe's financial metrics show impressive growth:
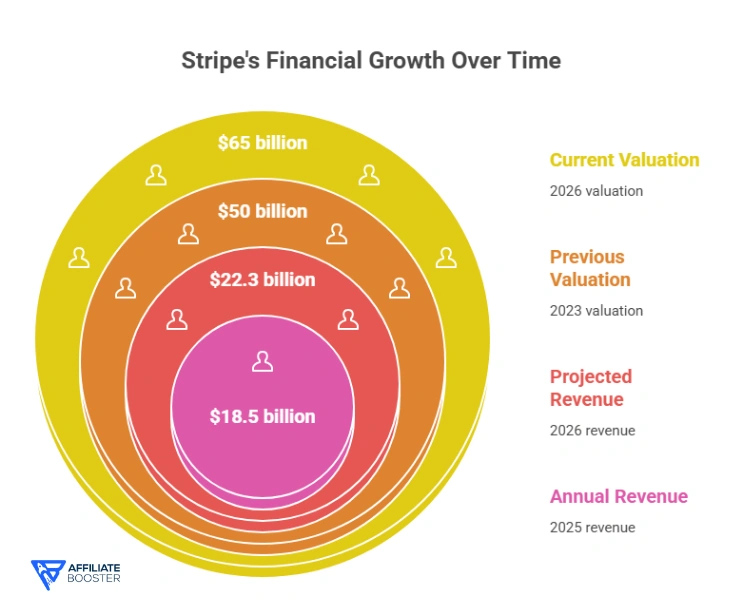
- Current company valuation: $65 billion (2026)
- Previous valuation (2023): $50 billion
- Annual revenue (2025): $18.5 billion
- Projected revenue (2026): $22.3 billion
- Revenue growth rate: 20.5% year-over-year
- Total funding raised: $8.7 billion
- Years to profitability: Became profitable in 2024
Company Size and Employment
Stripe's workforce reflects rapid expansion:
- Total employees worldwide: 9,800+ (2026)
- Employee growth rate: 15% annually
- Office locations: 25 cities globally
- Remote workforce: 48% of employees
- Engineering staff: 42% of total workforce
- Customer support team: 1,200+ specialists
Market Position
Stripe leads online payment processing:
| Payment Processor | Global Market Share | Annual Transaction Volume |
| Stripe | 21.7% | $1.2 trillion |
| PayPal | 19.4% | $1.1 trillion |
| Square | 12.8% | $720 billion |
| Adyen | 8.3% | $470 billion |
| Authorize.net | 7.1% | $400 billion |
Stripe holds the largest market share for online payment processing globally.
Stripe User and Customer Statistics
Understanding who uses Stripe reveals the platform's reach.
Total Active Users
Stripe's customer base grows steadily:
- Active businesses using Stripe: 4.8 million (2026)
- Growth from 2025: +850,000 new businesses
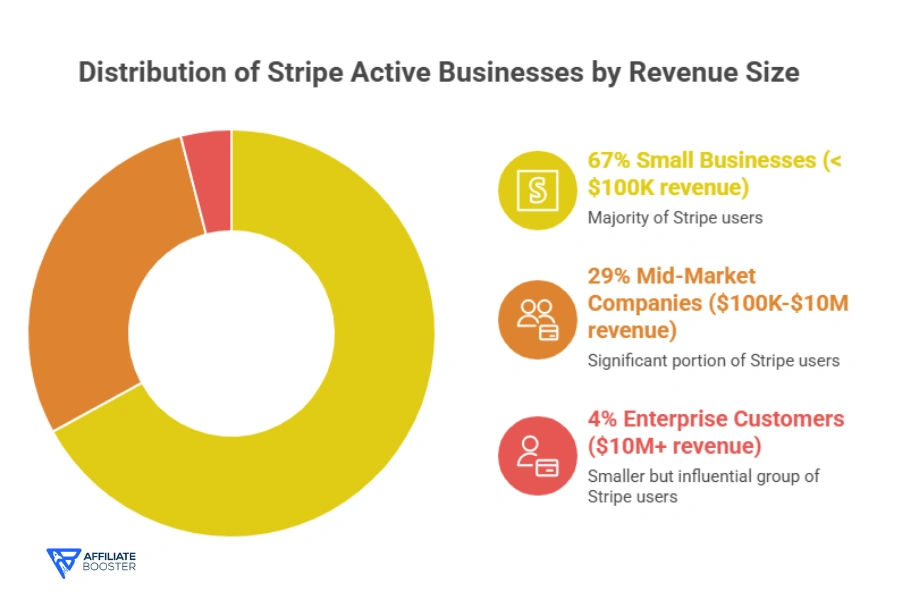
- Small businesses (under $100K revenue): 3.2 million (67%)
- Mid-market companies ($100K-$10M): 1.4 million (29%)
- Enterprise customers ($10M+): 200,000 (4%)
- Fortune 500 companies using Stripe: 87%
Geographic Distribution
Stripe operates in numerous countries:
- Countries where Stripe is available: 47 countries
- North American customers: 52%
- European customers: 31%
- Asia-Pacific customers: 13%
- Other regions: 4%
- Fastest growing market: India (67% growth)
- Largest customer base: United States (2.4 million businesses)
Customer Growth Trends
New business adoption accelerates:
- Daily sign-ups: 2,300+ new businesses
- Monthly activations: 70,000+ accounts
- Year-over-year customer growth: 21.5%
- Customer retention rate: 94%
- Businesses switching from competitors: 340,000 in 2025
Transaction Volume and Payment Statistics
Stripe processes enormous payment volumes daily.
Annual Transaction Volume
The numbers reveal massive scale:
- Total payment volume processed (2025): $1.2 trillion
- Expected volume (2026): $1.45 trillion
- Daily transaction volume: $3.97 billion
- Transactions processed annually: 42 billion+
- Average transaction size: $28.57
- Peak daily volume (Cyber Monday 2025): $12.4 billion
Transaction Processing Speed
Speed defines Stripe's performance:
- Average transaction processing time: 2.3 seconds
- API response time: 700 milliseconds
- Success rate for transactions: 99.7%
- Declined transaction rate: 4.3%
- Fraud-blocked transactions: 0.8%
Payment Method Distribution
Customers use various payment options:
| Payment Method | Percentage of Transactions | Growth Rate |
| Credit Cards | 58% | -2% |
| Debit Cards | 24% | +3% |
| Digital Wallets (Apple Pay, Google Pay) | 12% | +34% |
| Bank Transfers (ACH) | 4% | +18% |
| Buy Now Pay Later | 2% | +127% |
Digital wallets and BNPL options grow rapidly while card dominance slowly declines.
Industry and Sector Breakdown
Different industries rely on Stripe uniquely.
Top Industries Using Stripe
Sector distribution reveals patterns:
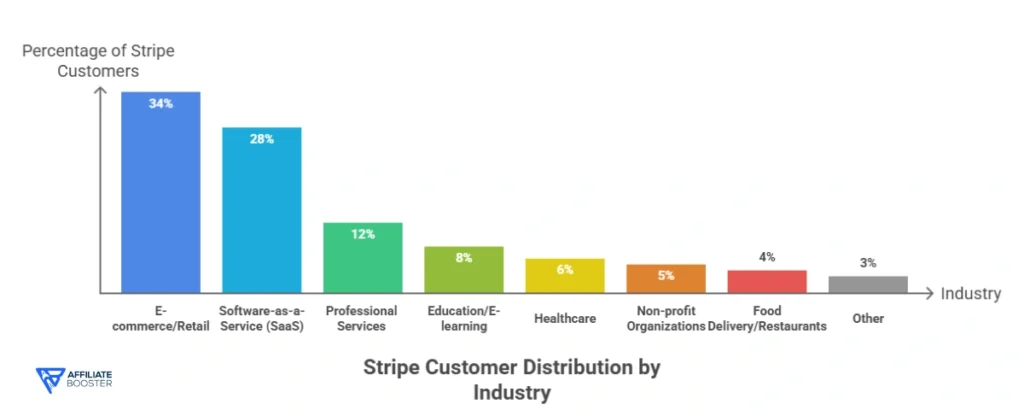
- E-commerce/Retail: 34% of Stripe customers
- Software-as-a-Service (SaaS): 28%
- Professional Services: 12%
- Education/E-learning: 8%
- Healthcare: 6%
- Non-profit Organizations: 5%
- Food Delivery/Restaurants: 4%
- Other: 3%
Industry-Specific Statistics
E-commerce Businesses
- Average monthly volume: $47,000
- Peak shopping period increase: 312% (November-December)
- Mobile payment percentage: 64%
- International sales: 28% of transactions
SaaS Companies
- Subscription revenue processed: $340 billion annually
- Average recurring charge: $89/month
- Churn management saves: $8.4 billion yearly
- Trial-to-paid conversion: 18% average
Marketplaces and Platforms
- Total marketplace volume: $287 billion
- Platform businesses using Stripe Connect: 670,000
- Average marketplace takes: 12-18% commission
- Multi-party payment splits: 2.3 million daily
Revenue and Pricing Statistics
Stripe's revenue model drives profitability.
Fee Structure
Standard Stripe pricing remains competitive:
- Standard online transaction fee: 2.9% + $0.30
- In-person transaction fee: 2.7% + $0.05
- International card fee: Additional 1.5%
- Currency conversion fee: 1%
- Instant payout fee: 1% (minimum $0.50)
Revenue Breakdown by Source
Multiple revenue streams contribute:
| Revenue Source | Percentage | Annual Amount (2025) |
| Transaction Fees | 67% | $12.4 billion |
| Subscription Services (Billing) | 18% | $3.3 billion |
| Stripe Connect (Platform Fees) | 9% | $1.7 billion |
| Other Products (Radar, Sigma) | 6% | $1.1 billion |
Average Revenue Per User
Customer value metrics:
- Average revenue per business annually: $3,854
- Small business ARPU: $890
- Mid-market ARPU: $12,400
- Enterprise ARPU: $78,500
- Customer lifetime value: $18,700
Product Adoption Statistics
Stripe offers diverse products beyond payment processing.
Popular Stripe Products
Usage rates across product suite:
- Stripe Payments: Used by 100% of customers (core product)
- Stripe Billing: 1.2 million businesses (25%)
- Stripe Connect: 670,000 platforms (14%)
- Stripe Radar (fraud prevention): 2.8 million businesses (58%)
- Stripe Terminal: 340,000 businesses (7%)
- Stripe Climate: 890,000 participants (19%)
- Stripe Tax: 1.6 million businesses (33%)
- Stripe Identity: 420,000 businesses (9%)
Subscription Business Statistics
Stripe Billing powers recurring revenue:
- Subscription businesses using Stripe: 1.2 million
- Total subscription revenue processed: $340 billion annually
- Average subscriber lifetime: 14.3 months
- Failed payment recovery rate: 38% with Smart Retries
- Dunning management success: $8.4 billion recovered in 2025
Platform and Marketplace Statistics
Stripe Connect enables complex payments:
- Platforms using Connect: 670,000
- Total marketplace volume: $287 billion
- Average platform has: 1,847 sellers/service providers
- Multi-party split payments: 2.3 million daily
- Fastest growing vertical: Creator economy platforms (+89%)
Global Expansion and Localization
Stripe expands internationally with local solutions.
Country Availability
Geographic footprint grows:
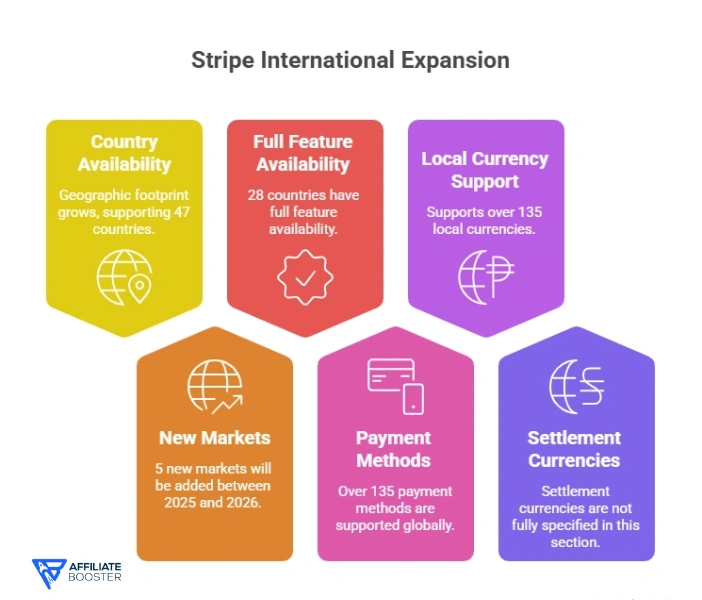
- Total countries supported: 47 countries
- New markets added (2025-2026): 5 countries
- Countries with full feature availability: 28
- Payment methods supported globally: 135+
- Local currency support: 135 currencies
- Settlement currencies: 38 currencies
International Transaction Statistics
Cross-border payments increase:
- International transactions: 32% of total volume
- Cross-border payment growth: 34% year-over-year
- Average international transaction: $67 (versus $28 domestic)
- Currency conversion volume: $384 billion annually
- Most common currency pairs: USD-EUR, USD-GBP, USD-CAD
Localization Efforts
Market-specific adaptations:
| Region | Local Payment Methods | Adoption Rate |
| Europe | SEPA, iDEAL, Bancontact | 67% |
| Asia | Alipay, WeChat Pay | 43% |
| Latin America | OXXO, Boleto | 38% |
| Australia | BECS Direct Debit | 29% |
Fraud Prevention and Security
Stripe prioritizes transaction security. Protection mechanisms evolve constantly.
Fraud Statistics
Security performance metrics:
- Fraud rate on Stripe: 0.08% (industry average: 0.47%)
- Transactions blocked by Stripe Radar: $27 billion in 2025
- Machine learning models analyzing: 1,000+ risk signals
- False positive rate: 2.1% (industry average: 8%)
- Businesses using Radar for Fraud Teams: 890,000
Security Features
Protection layers implemented:
- PCI DSS Level 1 compliance: Maintained since 2012
- 3D Secure authentication adoption: 67% of eligible transactions
- Biometric authentication supported: Yes (Face ID, Touch ID)
- Two-factor authentication: Available for all accounts
- Encryption standard: AES-256 for data at rest
Dispute and Chargeback Statistics
Managing payment disputes:
- Average chargeback rate: 0.6% (below 1% industry threshold)
- Disputes resolved in merchant favor: 58%
- Average dispute resolution time: 45 days
- Chargeback fees: $15 per dispute
- Stripe assistance with evidence: Saves merchants $340 million annually
Developer and API Statistics
Stripe's developer-first approach drives adoption.
Developer Community
Engineering engagement metrics:
- Registered developer accounts: 2.8 million
- API calls processed daily: 18.4 billion
- GitHub stars for Stripe libraries: 67,000+
- Stack Overflow questions tagged ‘stripe': 89,000+
- Monthly API documentation views: 12 million
API Performance
Technical specifications:
- Average API response time: 700 milliseconds
- API uptime: 99.99%
- Supported programming languages: 12 official libraries
- Webhook delivery success rate: 99.8%
- Rate limit for API calls: 100 requests per second (standard)
Integration Statistics
Implementation metrics:
- Average integration time: 2.8 hours for basic setup
- Pre-built integrations available: 600+ apps and platforms
- WooCommerce installations: 1.2 million
- Shopify merchants using Stripe: 840,000
- Custom integration percentage: 34% (versus plugins)
Mobile and Digital Wallet Statistics
Mobile commerce drives Stripe growth.
Mobile Transaction Volume
Smartphone payments surge:
- Mobile transaction percentage: 64% of total volume
- Mobile-only businesses: 1.8 million (38% of customers)
- Average mobile transaction: $23 (versus $37 desktop)
- Mobile conversion rate: 2.8% (versus 4.1% desktop)
- Mobile payment growth: 28% year-over-year
Digital Wallet Adoption
Apple Pay and Google Pay integration:
- Transactions via Apple Pay: $142 billion annually
- Google Pay volume: $87 billion
- Digital wallet conversion lift: 34% versus manual entry
- Businesses accepting digital wallets: 4.2 million (88%)
- One-click checkout adoption: 67%
Tap to Pay Statistics
Contactless payment growth:
- Stripe Terminal users: 340,000 businesses
- Tap to Pay on iPhone adoption: 120,000 merchants
- In-person payment volume: $84 billion annually
- Contactless transaction percentage: 73% of in-person
- Average in-person transaction: $18
Emerging Markets and Future Trends
Stripe invests in next-generation payment technologies.
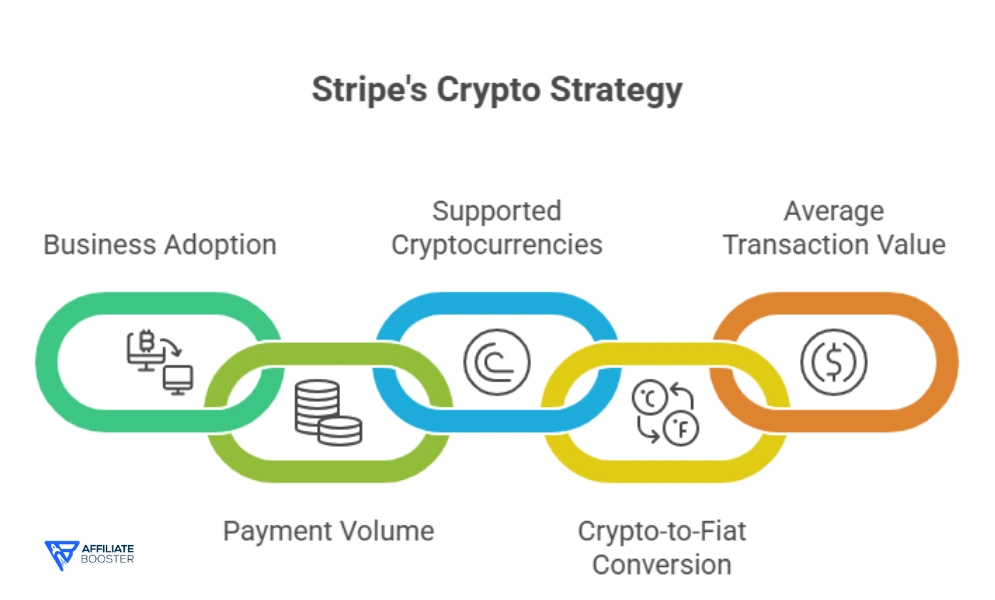
Cryptocurrency Support
Digital currency integration:
- Businesses accepting crypto via Stripe: 78,000
- Crypto payment volume: $4.2 billion annually
- Supported cryptocurrencies: Bitcoin, Ethereum, USDC
- Crypto-to-fiat conversion: Automatic (merchant receives local currency)
- Average crypto transaction: $187
Embedded Finance
Financial services integration:
- Businesses using Stripe Treasury: 45,000
- Total funds held in Treasury accounts: $12.4 billion
- Stripe Issuing cards created: 8.7 million
- Issuing transaction volume: $23 billion
- Embedded lending facilitated: $890 million
AI and Automation
Artificial intelligence applications:
- AI-powered fraud detection accuracy: 99.2%
- Automated revenue recognition: Used by 340,000 businesses
- Predictive churn modeling: Identifies 73% of at-risk subscribers
- Smart routing optimization: Increases approval rates by 3-7%
- AI-generated financial reports: 4.2 million monthly
Competitor Comparison
How Stripe measures against alternatives.
Feature Comparison
Platform capabilities side-by-side:
| Feature | Stripe | PayPal | Square | Adyen |
| Online Payments | ✓ | ✓ | ✓ | ✓ |
| In-Person | ✓ | ✓ | ✓ | ✓ |
| Subscription Billing | ✓ | Limited | ✓ | ✓ |
| Developer API | Excellent | Good | Good | Excellent |
| Global Reach | 47 countries | 200+ countries | Limited | 46 countries |
| Pricing Transparency | High | Medium | High | Medium |
Market Perception
Brand reputation metrics:
- Developer satisfaction: 92% (highest in industry)
- Overall customer satisfaction: 4.6/5 stars
- Net Promoter Score: 67
- Brand awareness among startups: 89%
- Recommendation rate: 84%
FAQs About Stripe Statistics
Also Read About:
- Apple Music Statistics
- Zoom Statistics
- ChatGPT Statistics
- Perplexity AI Statistics
- Meta AI Users Statistics
Conclusion
Stripe dominates online payment processing with 4.8 million businesses and $1.2 trillion in annual volume.
The platform's developer-friendly approach, robust security, and comprehensive product suite drive continued 21% growth despite market maturity.