Influencer marketing has exploded in recent years. Brands now spend billions working with content creators. The results speak for themselves.
This guide covers the latest influencer marketing statistics for 2026. You'll discover spending trends, ROI data, and platform preferences. Let's dive into the numbers that matter.
The Growth of Influencer Marketing
The influencer marketing industry continues its meteoric rise. Here's what the data shows.
Market Size and Growth
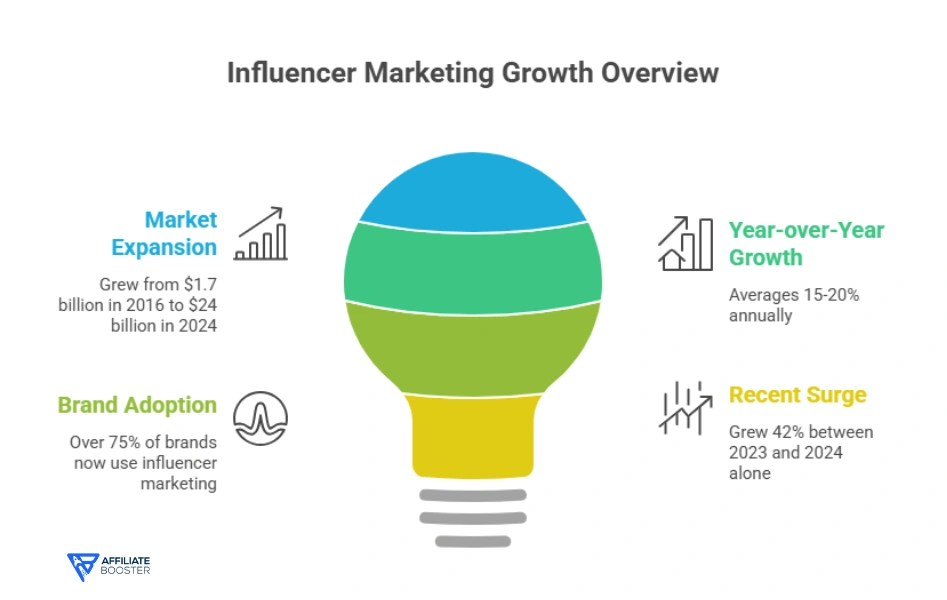
The global influencer marketing market reached $24 billion in 2024. Industry experts project it will hit $28.5 billion by 2026.
That's a growth rate of nearly 19% in just two years. The industry shows no signs of slowing down.
Key growth statistics include:
- The market grew from $1.7 billion in 2016 to $24 billion in 2024
- Year-over-year growth averages 15-20%
- Over 75% of brands now use influencer marketing
- The industry grew 42% between 2023 and 2024 alone
Platform Distribution Statistics
Different platforms attract different budgets. Here's where brands invest their money.
| Platform | Percentage of Budget | Average Engagement Rate |
| 68% | 1.22% | |
| TikTok | 45% | 5.96% |
| YouTube | 33% | 1.63% |
| 28% | 0.15% | |
| X (Twitter) | 12% | 0.045% |
| 15% | 2.1% |
Instagram remains the top choice for influencer campaigns. However, TikTok delivers the highest engagement rates.
Many brands now use multiple platforms. Cross-platform strategies deliver better results.
Also read about: Social Media Statistics
Influencer Marketing ROI and Performance
Return on investment matters most to businesses. The statistics show impressive results.
Revenue Generation
Brands earn significant returns from influencer marketing:
- Businesses make $5.78 for every dollar spent on influencer marketing
- This ROI increased from $5.20 in 2023
- 89% of marketers say influencer marketing ROI matches or exceeds other channels
- 17% of brands spend over half their marketing budget on influencers
Conversion and Sales Impact
Influencer content drives real purchases. Consider these conversion statistics:
- 49% of consumers make purchases monthly based on influencer posts
- 86% of women use social media for purchasing advice
- 70% of teenage YouTube subscribers trust influencer opinions over celebrities
- Influencer recommendations are trusted 3x more than brand advertisements
Customer Acquisition Costs
Influencer marketing offers competitive acquisition costs:
- Cost per acquisition through influencers: $53.20 (average)
- Traditional digital advertising CPA: $72.40 (average)
- Influencer-driven customers show 37% higher retention rates
- Micro-influencer campaigns cost 6.7x less than celebrity campaigns
Influencer Types and Their Impact
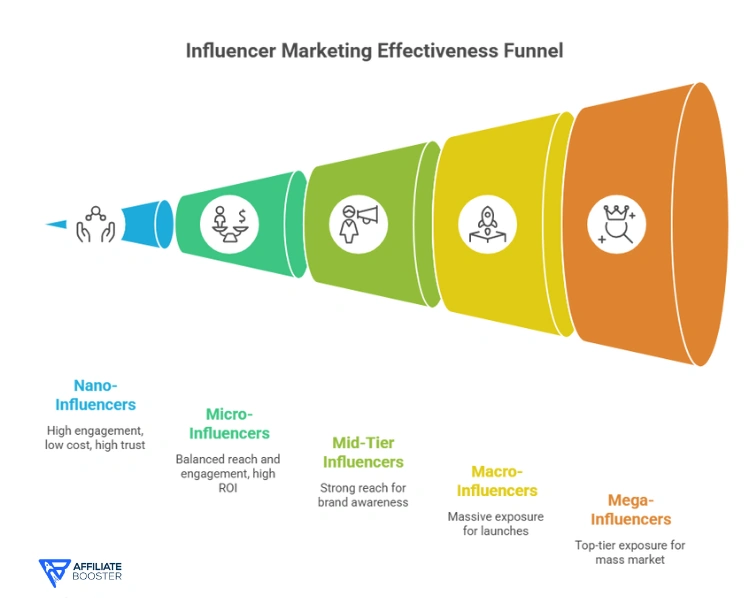
Not all influencers deliver the same results. Size matters, but not how you think.
Nano-Influencers (1K-10K followers)
Nano-influencers pack surprising power:
- Average engagement rate: 8.7%
- Cost per post: $10-$100
- Audience trust level: 92%
- Best for: Local businesses and niche products
Nano-influencers maintain close relationships with followers. Their recommendations feel authentic and personal.
Micro-Influencers (10K-100K followers)
Micro-influencers dominate the market:
- 77% of brands prefer working with micro-influencers
- Average engagement rate: 3.86%
- Cost per post: $100-$1,000
- Deliver highest ROI among all influencer tiers
These creators balance reach with engagement. They're affordable and effective.
Mid-Tier Influencers (100K-500K followers)
Mid-tier influencers offer strong reach:
- Average engagement rate: 2.42%
- Cost per post: $1,000-$10,000
- 65% of brands use mid-tier influencers regularly
- Best for: Brand awareness campaigns
Macro-Influencers (500K-1M followers)
Macro-influencers provide massive exposure:
- Average engagement rate: 1.67%
- Cost per post: $10,000-$100,000
- 34% of brands work with macro-influencers
- Best for: Product launches and major campaigns
Mega-Influencers (1M+ followers)
Mega-influencers and celebrities command top dollar:
- Average engagement rate: 1.21%
- Cost per post: $100,000-$1,000,000+
- Only 23% of brands can afford mega-influencers
- Best for: Mass market brands with large budgets
Also read about: Instagram Reels Statistics
Content Format Performance Statistics
Different content types drive different results. Here's what works best.
Video Content Dominance
Video content leads engagement metrics:
- 73% of consumers prefer learning about products through video
- Video posts generate 49% higher engagement than static images
- Short-form video (under 60 seconds) performs best
- TikTok and Instagram Reels show 2.3x higher engagement than feed posts
Live Streaming Statistics
Live content creates urgency and authenticity:
- Live streams generate 6x more engagement than regular videos
- 82% of audiences prefer live video over social posts
- Live shopping events convert at 30% higher rates
- Average live stream watch time: 26.4 minutes
Story and Ephemeral Content
Temporary content drives immediate action:
- Instagram Stories reach 500 million users daily
- 58% of people become more interested after seeing products in Stories
- Story ads have 0.33% swipe-up rates (industry average)
- 86% of influencers use Stories for brand partnerships
Also read about: YouTube Shorts Statistics
Industry-Specific Statistics
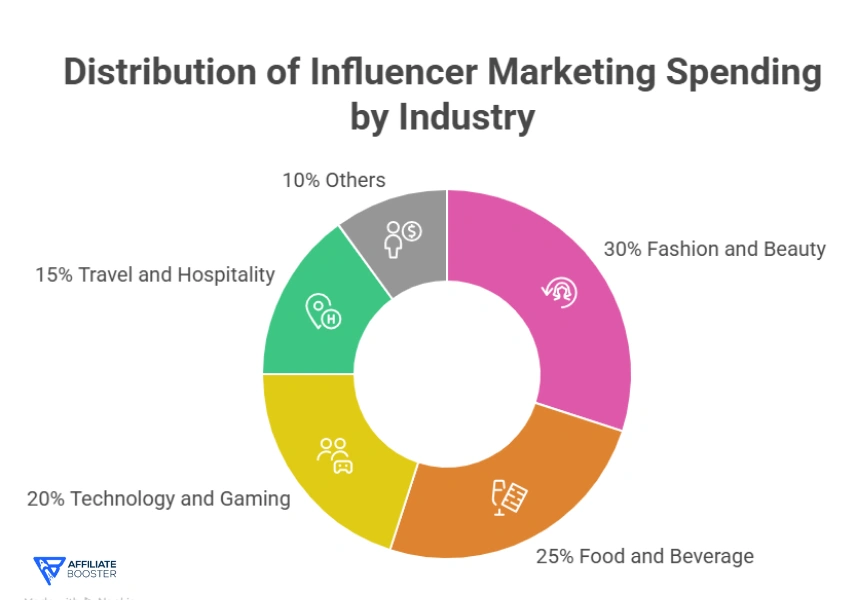
Influencer marketing works differently across industries. Here's the breakdown.
Fashion and Beauty
Fashion and beauty lead influencer spending:
- 57% of fashion brands use influencer marketing
- Beauty influencer market worth: $6.8 billion
- Average campaign engagement: 4.5%
- 71% of beauty purchases influenced by social media
Food and Beverage
Food influencers drive restaurant visits and product sales:
- Food content generates 2.2 billion engagements monthly
- 44% of consumers discover restaurants through influencers
- Recipe content has 5.3x higher save rates
- Food influencer campaigns deliver $7.20 ROI per dollar spent
Technology and Gaming
Tech influencers command loyal audiences:
- Gaming influencer market: $4.2 billion
- Tech review videos generate 89% higher purchase intent
- Average tech influencer engagement: 3.1%
- 67% of gamers follow gaming influencers
Travel and Hospitality
Travel influencers inspire bookings:
- 87% of travelers inspired by social media content
- Travel influencer partnerships grew 52% in 2024
- Average cost per engagement: $0.42
- User-generated travel content drives 6.9x higher engagement
Also read about: X (Twitter) Statistics
Demographic Insights
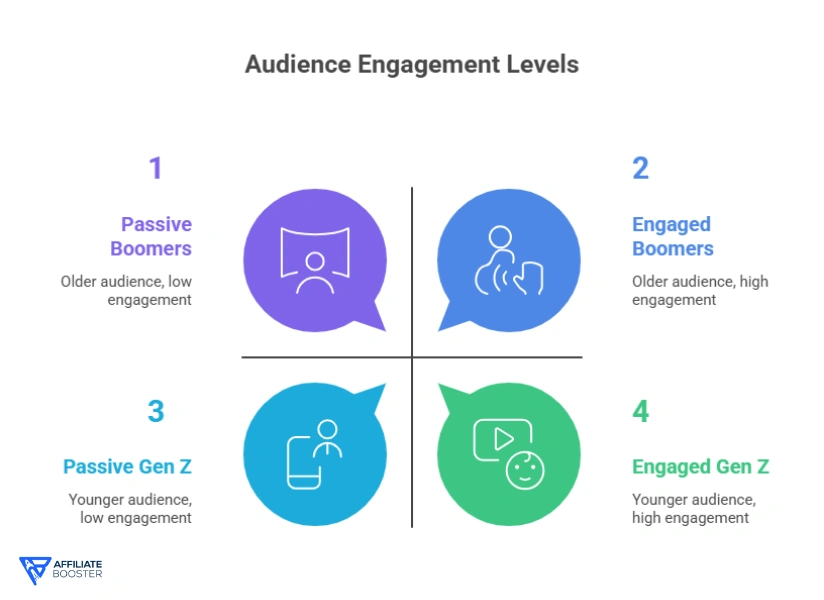
Different age groups respond differently to influencer marketing.
Gen Z (Born 1997-2012)
Gen Z drives influencer marketing growth:
- 85% of Gen Z discover products through social media
- 44% make purchases weekly based on influencer posts
- TikTok preference: 67%
- Trust influencers more than traditional celebrities: 88%
Millennials (Born 1981-1996)
Millennials remain highly engaged:
- 71% follow influencers regularly
- Make influencer-driven purchases monthly: 49%
- Prefer Instagram: 61%
- Value authenticity over production quality: 79%
Gen X (Born 1965-1980)
Gen X increasingly engages with influencer content:
- 38% follow influencers on social media
- Growing audience for Facebook influencers
- Prefer expert influencers over entertainers: 72%
- Focus on product reviews and educational content
Baby Boomers (Born 1946-1964)
Even older demographics engage with influencers:
- 24% follow at least one influencer
- Prefer YouTube and Facebook content
- Trust expert recommendations: 81%
- Growing segment for health and finance influencers
Authenticity and Trust Statistics
Authenticity drives influencer marketing success. The numbers prove it.
Disclosure and Transparency
Proper disclosure builds trust:
- 92% of consumers want clear sponsorship disclosure
- Posts with #ad or #sponsored see 24% lower engagement
- However, hidden sponsorships damage brand trust by 67%
- 78% of consumers appreciate honest product reviews (positive or negative)
Fake Follower Problem
Fake followers plague the industry:
- 15% of influencer followers are fake accounts
- Brands lose $1.3 billion annually to influencer fraud
- 67% of marketers struggle to identify authentic influencers
- Engagement rate matters more than follower count
Audience Trust Levels
Trust varies by influencer type:
| Influencer Category | Trust Level | Purchase Influence |
| Nano-influencers | 92% | 87% |
| Micro-influencers | 88% | 82% |
| Mid-tier influencers | 71% | 68% |
| Macro-influencers | 58% | 54% |
| Celebrities | 42% | 38% |
Smaller influencers maintain stronger trust. Their audiences view them as peers rather than advertisers.
Emerging Trends in 2026
The influencer marketing landscape evolves rapidly. Here are the latest trends.
AI and Virtual Influencers
Artificial intelligence transforms influencer marketing:
- Virtual influencer market worth: $15.5 billion
- 58% of Gen Z follow at least one virtual influencer
- AI-generated content costs 70% less than traditional production
- 42% of consumers don't mind if influencers use AI tools
Long-Term Partnerships
Brands shift from one-off posts to relationships:
- 67% of brands prefer long-term partnerships
- Ambassador programs deliver 2.3x better ROI
- Average partnership length: 8.4 months (up from 3.2 months in 2022)
- Consistent collaborations build 40% stronger brand recall
Social Commerce Integration
Shopping features drive direct sales:
- Social commerce sales: $992 billion globally in 2025
- 78% of influencers use shopping tags
- Live shopping conversion rate: 30% (vs. 2-3% traditional e-commerce)
- TikTok Shop GMV growth: 280% year-over-year
Diversity and Inclusion
Representation matters to consumers:
- 71% prefer brands working with diverse influencers
- Campaigns featuring diverse creators see 23% higher engagement
- 64% of consumers more likely to buy from inclusive brands
- LGBTQ+ influencer partnerships grew 89% in 2024
Budget and Spending Statistics
How much do brands invest in influencer marketing?
Overall Marketing Budget Allocation
Influencer marketing claims growing budget share:
- Average allocation: 23% of total marketing budget
- Up from 18% in 2023
- 61% of marketers plan to increase spending in 2026
- 25% of brands spend over $500,000 annually on influencers
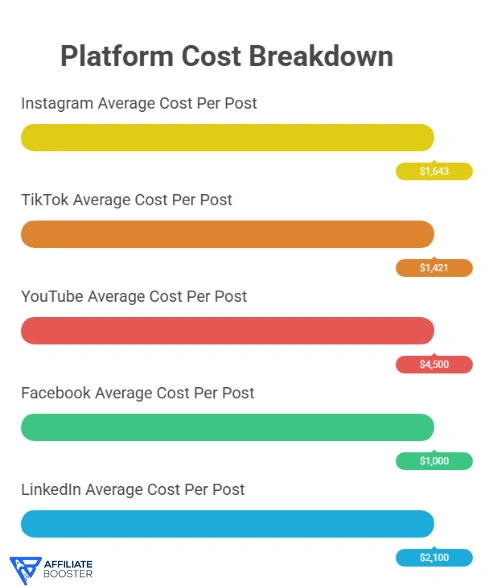
Cost Breakdown by Platform
Platform costs vary significantly:
| Platform | Average Cost Per Post | Cost Per 1K Followers |
| $1,643 | $100 | |
| TikTok | $1,421 | $80 |
| YouTube | $4,500 | $200 |
| $1,000 | $90 | |
| $2,100 | $120 |
YouTube commands premium rates. However, videos deliver longer shelf life.
Campaign Budget Distribution
Where does campaign money go?
- Influencer fees: 52%
- Content production: 18%
- Platform advertising boosts: 15%
- Management and tools: 10%
- Performance tracking: 5%
Challenges and Pain Points
Influencer marketing isn't without obstacles. Brands face several challenges.
Top Marketer Challenges
The biggest struggles marketers report:
- Finding the right influencers: 67%
- Measuring ROI accurately: 54%
- Managing multiple relationships: 48%
- Staying within budget: 42%
- Ensuring brand safety: 39%
Influencer-Side Challenges
Creators face their own difficulties:
- Maintaining authenticity while monetizing: 71%
- Negotiating fair compensation: 64%
- Managing brand expectations: 58%
- Content burnout: 52%
- Platform algorithm changes: 87%
Measurement and Analytics
Tracking success requires proper metrics. Here's what matters.
Key Performance Indicators
Brands track various metrics:
- Engagement rate: Measured by 89% of brands
- Reach and impressions: 82%
- Conversion rate: 76%
- Brand sentiment: 58%
- Cost per acquisition: 71%
Attribution Challenges
Measuring true impact remains difficult:
- 54% of marketers struggle with attribution
- Multi-touch attribution used by only 32% of brands
- Unique promo codes track 45% of conversions
- Affiliate links account for 38% of tracking methods
Tools and Technology
Marketers use various platforms:
- 73% use influencer marketing platforms
- Average tool cost: $2,400 monthly
- AI-powered discovery tools growing 127% year-over-year
- 61% of brands use multiple tools for management
Future Predictions
Where is influencer marketing headed? Experts make these predictions.
Market Growth Projections
The industry continues expanding:
- Expected market size by 2028: $42.3 billion
- Compound annual growth rate: 18.9%
- Number of influencer marketing platforms: Growing to 1,200+ by 2027
- Brands using influencer marketing: Projected 92% by 2027
Technology Integration
New technologies will reshape the space:
- Blockchain for transparency: Adoption growing 156%
- Virtual reality experiences: 34% of brands experimenting
- AI content creation: Used by 67% of influencers
- Metaverse activations: $2.1 billion market opportunity
Regulatory Changes
Expect stricter guidelines:
- 78% of countries implementing disclosure laws
- Platform-enforced transparency tools
- Stricter penalties for non-disclosure
- Authenticity verification requirements
FAQs About Influencer Marketing Statistics
Also Read About:
- Apple Music Statistics
- Zoom Statistics
- ChatGPT Statistics
- Perplexity AI Statistics
- Meta AI Users Statistics
Conclusion
Influencer marketing continues its explosive growth in 2026. The industry will reach $28.5 billion this year.
The data shows clear trends. Micro-influencers deliver the best ROI. TikTok drives the highest engagement. Authenticity matters more than follower count.
Brands earn $5.78 for every dollar invested. That's a compelling return in any marketing channel.
The future looks bright. New technologies like AI and virtual influencers expand possibilities. Social commerce integration makes purchasing seamless. Diversity and long-term partnerships strengthen campaigns.
Success requires strategy. Choose influencers who align with your brand values. Track the right metrics. Focus on authentic relationships over one-off posts.
Start small if you're new to influencer marketing. Test different creators and platforms. Scale what works.
The statistics don't lie. Influencer marketing delivers results when done right. Use these insights to build campaigns that convert.
Source: Statista, ResearchGate