Content Management Systems power the modern web. These platforms enable businesses to manage digital content efficiently.
This comprehensive guide covers CMS statistics for 2026. You'll discover market share, usage trends, and platform comparisons.
Let's explore the numbers behind content management.
CMS Statistics: CMS Market Overview
The CMS industry continues evolving rapidly. Competition drives innovation across platforms.
Global CMS Market Size
Market value and growth metrics:
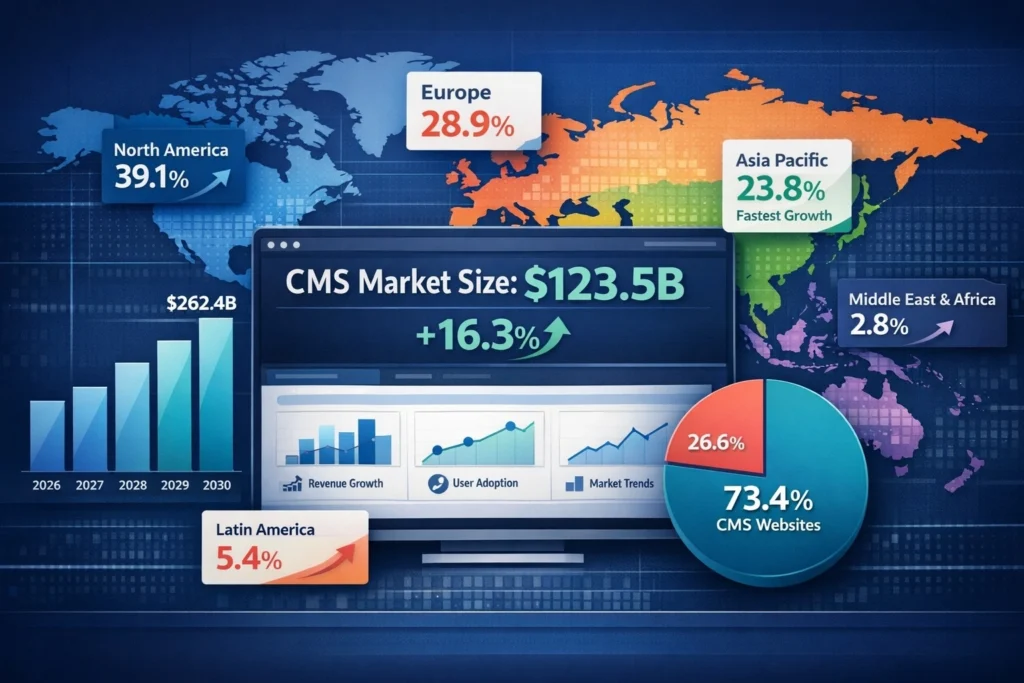
- Global CMS market value (2026): $123.5 billion
- Growth from 2025: +16.3%
- Projected market size (2030): $262.4 billion
- Compound annual growth rate: 20.7%
- Enterprise CMS market: $78.2 billion (63%)
- Web CMS market: $45.3 billion (37%)
CMS Adoption Statistics
Platform usage worldwide:
- Websites using a CMS: 73.4% of all websites
- Websites without CMS: 26.6%
- Total CMS-powered sites: 302 million (active)
- New CMS sites created daily: 185,000
- Companies planning CMS migration: 34%
- Multi-CMS environments: 42% of enterprises
Regional Market Distribution
Geographic breakdown:
| Region | Market Size 2026 | Growth Rate | Market Share |
| North America | $48.3 billion | 15.2% | 39.1% |
| Europe | $35.7 billion | 16.8% | 28.9% |
| Asia Pacific | $29.4 billion | 22.4% | 23.8% |
| Latin America | $6.8 billion | 18.7% | 5.5% |
| Middle East & Africa | $3.3 billion | 21.3% | 2.7% |
North America leads market. Asia Pacific grows fastest.
Also read about: Web Development Statistics 2026: Market Trends & Industry Data
CMS Market Share Statistics
Understanding platform dominance reveals industry dynamics.
Overall CMS Usage
Market share among all websites using CMS:
| CMS Platform | Market Share | Active Websites | Change YoY |
| WordPress | 64.2% | 194M | +2.1% |
| Shopify | 6.6% | 20M | +14.8% |
| Wix | 4.9% | 15M | +7.3% |
| Squarespace | 3.5% | 11M | +9.2% |
| Joomla | 2.6% | 8M | -3.4% |
| Drupal | 1.8% | 5M | -1.2% |
| Adobe Experience Manager | 0.8% | 2.4M | +5.7% |
| Webflow | 1.2% | 3.6M | +34.6% |
| Ghost | 0.4% | 1.2M | +18.2% |
| Others | 14.0% | 42M | Various |
WordPress dominates with nearly two-thirds market share. Webflow shows explosive growth.
Market Share Among Top 1 Million Sites
High-traffic website preferences:
- WordPress: 38.7%
- Adobe Experience Manager: 8.4%
- Drupal: 6.2%
- Shopify: 5.9%
- Wix: 3.1%
- Sitecore: 2.8%
- Custom CMS: 24.3%
- Others: 10.6%
Enterprise sites use more diverse platforms. Custom solutions remain significant.
Headless CMS Market Share
Decoupled architecture adoption:
- Headless CMS market size: $1.4 billion (2026)
- Growth rate: +34.7% annually
- Companies using headless: 18% (up from 8% in 2023)
- Planning migration to headless: 29%
Leading headless platforms:
- Contentful: 28.4% market share
- Strapi: 19.7%
- Sanity: 16.2%
- Prismic: 11.3%
- Hygraph: 8.9%
- Others: 15.5%
Headless CMS grows rapidly for flexibility.
WordPress Statistics

WordPress remains the dominant platform. Its ecosystem drives web development.
WordPress Market Dominance
Usage and adoption metrics:
- Total WordPress sites: 835 million (including inactive)
- Active WordPress sites: 194 million
- WordPress powers: 43.2% of all websites
- Market share among CMS: 64.2%
- New WordPress sites daily: 127,000
- WordPress downloads daily: 287,000
WordPress.com vs WordPress.org
Platform comparison:
- WordPress.org (self-hosted): 89% of WordPress sites
- WordPress.com (hosted): 11% of WordPress sites
- WordPress.com paying customers: 12.4 million
- WordPress.com free sites: 78.6 million
Self-hosting dominates for flexibility and control.
WordPress Plugin Statistics
Plugin ecosystem strength:
- Available plugins: 61,847 (official repository)
- Total plugin downloads: 4.2 billion (lifetime)
- Average plugins per site: 23
- Active installations (top plugin): 5+ million
- Premium plugin market: $1.8 billion annually
Top plugin categories:
- SEO: 18.4M average active installations
- Security: 16.7M
- Performance: 14.2M
- E-commerce: 13.8M
- Forms: 12.3M
WordPress Theme Statistics
Design template metrics:
- Free themes available: 11,234
- Premium themes market: $2.3 billion
- ThemeForest sales: 187,000 themes sold monthly
- Average themes tested before selection: 7.3
- Custom theme development: 34% of sites
WooCommerce Statistics
WordPress e-commerce dominance:
- WooCommerce sites: 6.4 million active stores
- E-commerce CMS market share: 28.7%
- New WooCommerce stores daily: 2,300
- Average store revenue: $287,000 annually
- WooCommerce extensions: 7,800+ available
Enterprise CMS Statistics
Large organizations require robust solutions.
Enterprise Platform Adoption
Major CMS usage in large companies:
| Platform | Enterprise Adoption | Fortune 500 Usage | Starting Price |
| Adobe Experience Manager | 34% | 87 companies | $150,000/year |
| Sitecore | 28% | 76 companies | $100,000/year |
| Drupal | 23% | 58 companies | Free (self-host) |
| WordPress VIP | 19% | 43 companies | $25,000/year |
| Contentful | 16% | 34 companies | $489/month |
| Acquia | 14% | 28 companies | Custom |
Adobe and Sitecore dominate enterprise market.
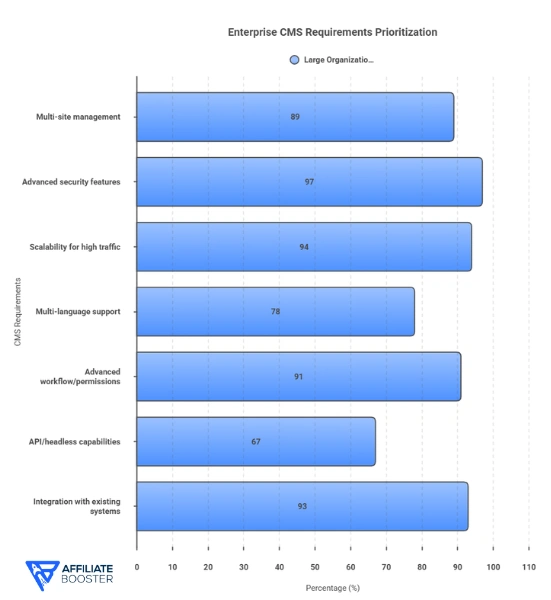
Enterprise CMS Requirements
What large organizations prioritize:
- Multi-site management: Required by 89%
- Advanced security features: 97%
- Scalability for high traffic: 94%
- Multi-language support: 78%
- Advanced workflow/permissions: 91%
- API/headless capabilities: 67%
- Integration with existing systems: 93%
Security and scalability top enterprise concerns.
Enterprise Implementation Costs
Investment required for major platforms:
- Initial setup: $50,000-$500,000
- Annual licensing: $25,000-$300,000
- Customization: $100,000-$1,000,000
- Training: $10,000-$50,000
- Ongoing maintenance: 15-20% of total annually
- Migration from legacy: $75,000-$750,000
Enterprise CMS requires substantial investment.
E-commerce CMS Statistics
Online shopping drives specialized CMS demand.
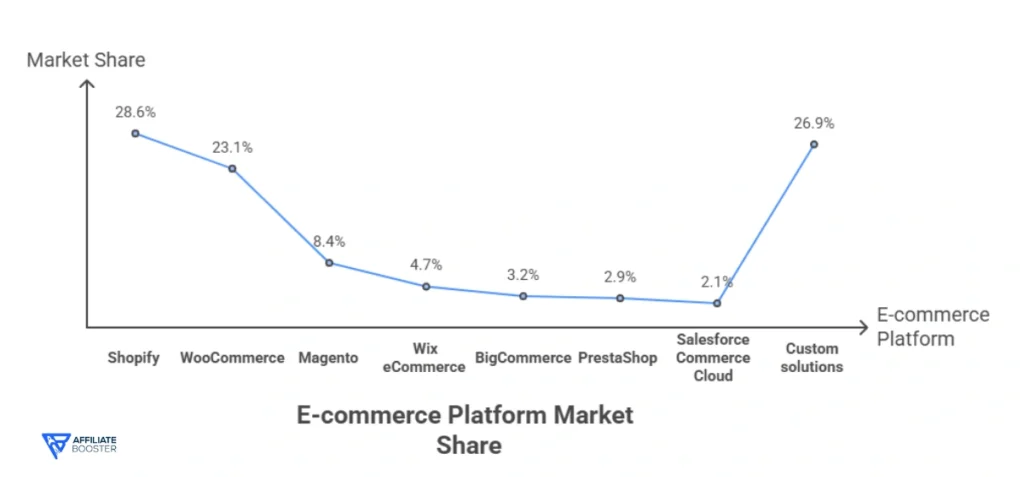
E-commerce Platform Market Share
Shopping platform distribution:
- Shopify: 28.6% of e-commerce sites
- WooCommerce: 23.1%
- Magento: 8.4%
- Wix eCommerce: 4.7%
- BigCommerce: 3.2%
- PrestaShop: 2.9%
- Salesforce Commerce Cloud: 2.1%
- Custom solutions: 26.9%
Shopify leads hosted solutions. WooCommerce dominates self-hosted.
Shopify Specific Statistics
Platform performance metrics:
- Total Shopify stores: 4.8 million
- Active stores: 2.1 million
- Shopify Plus (enterprise): 28,000 stores
- GMV (Gross Merchandise Volume): $235 billion (2025)
- Average store revenue: $112,000 annually
- Apps available: 8,200+
Also read about: Shopify Review: What’s New with Shopify in 2026?
E-commerce CMS Features
Most important capabilities:
- Mobile optimization: Essential for 98%
- Payment gateway integrations: 96%
- Inventory management: 94%
- SEO capabilities: 92%
- Analytics/reporting: 89%
- Multi-channel selling: 76%
- Abandoned cart recovery: 84%
Mobile optimization becomes non-negotiable.
Also read about: E-commerce Statistics 2026: Online Shopping Trends and Data
Open Source vs Proprietary CMS
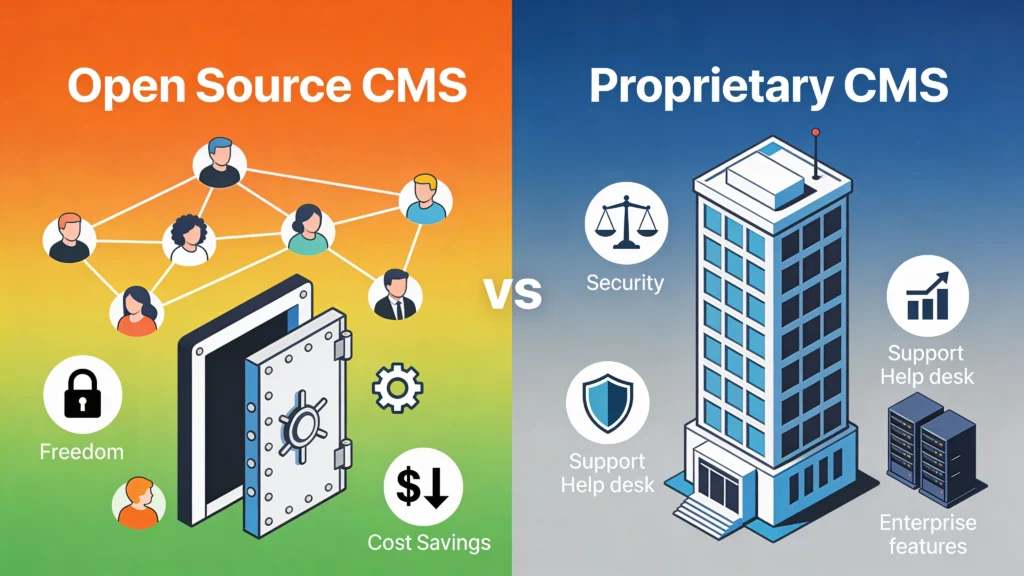
Platform philosophy impacts choice.
Open Source CMS Adoption
Free platform statistics:
- Organizations using open source: 67%
- WordPress (open source): 43.2% of all sites
- Drupal: 1.8%
- Joomla: 2.6%
- Total cost savings: 60-80% versus proprietary
Benefits cited:
- No licensing fees: 89%
- Community support: 76%
- Customization flexibility: 84%
- Avoid vendor lock-in: 71%
Proprietary CMS Usage
Commercial platform adoption:
- Companies using proprietary CMS: 33%
- Prefer vendor support: 78% of proprietary users
- Integration guarantees valued: 82%
- Security updates crucial: 91%
Leading proprietary platforms:
- Adobe Experience Manager: $78.2B market
- Sitecore: $12.4B market
- Kentico: $2.1B market
Total Cost of Ownership
5-year cost comparison:
| CMS Type | Initial Cost | Annual Cost | 5-Year TCO |
| Open Source (self-hosted) | $5K-$50K | $10K-$100K | $55K-$550K |
| Open Source (managed) | $2K-$20K | $15K-$150K | $77K-$770K |
| Proprietary (mid-market) | $25K-$100K | $30K-$150K | $175K-$850K |
| Enterprise Proprietary | $100K-$500K | $100K-$300K | $600K-$2M |
Open source offers significant cost advantages.
CMS User Experience and Satisfaction
Platform usability drives adoption.
User Satisfaction Scores
Platform ratings from users:
- Webflow: 4.6/5 stars (highest satisfaction)
- WordPress: 4.4/5
- Squarespace: 4.3/5
- Shopify: 4.5/5
- Wix: 4.2/5
- Drupal: 3.9/5
- Joomla: 3.7/5
Modern, user-friendly platforms score highest.
Ease of Use Rankings
Learning curve assessment:
- Easiest: Wix, Squarespace, Webflow (visual editors)
- Moderate: WordPress (with page builders)
- Challenging: Drupal, Joomla (steeper learning)
- Developer-focused: Contentful, Strapi (headless)
Time to Launch
Average implementation timelines:
- Website builders (Wix, Squarespace): 1-2 weeks
- WordPress (template): 2-4 weeks
- WordPress (custom): 6-12 weeks
- Shopify (basic): 2-4 weeks
- Enterprise CMS: 3-12 months
Simple sites launch quickly. Enterprise takes months.
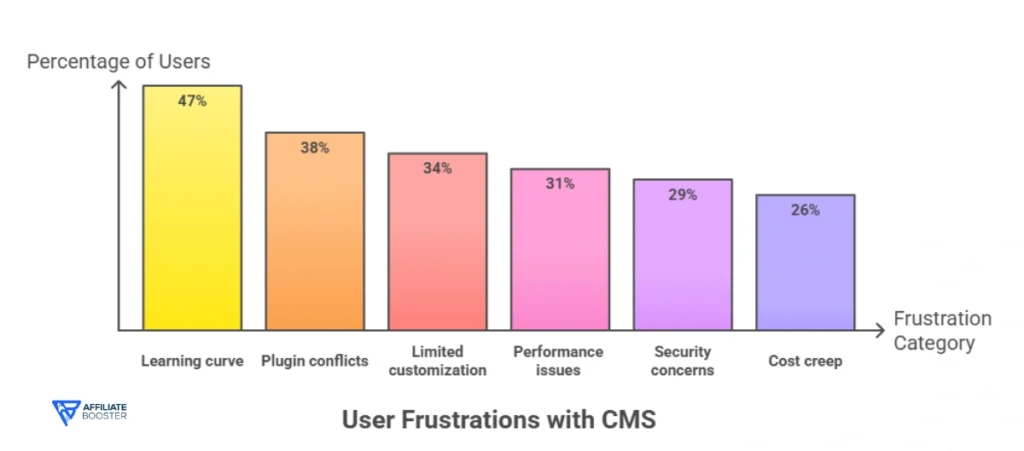
Common Pain Points
User frustrations:
- Learning curve: Cited by 47%
- Plugin conflicts: 38% (WordPress)
- Limited customization: 34% (hosted platforms)
- Performance issues: 31%
- Security concerns: 29%
- Cost creep: 26% (premium features)
Mobile CMS Management
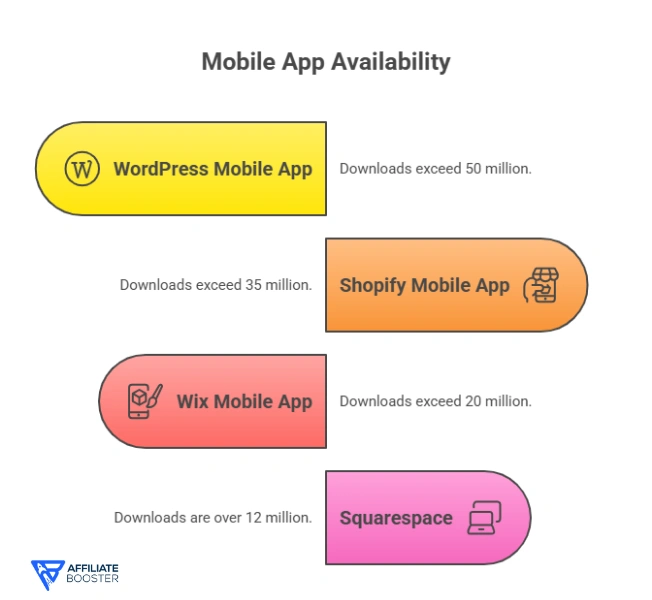
Managing content on mobile devices.
Mobile App Availability
Platform mobile apps:
- WordPress mobile app: Downloads 50M+
- Shopify mobile app: 35M+ downloads
- Wix mobile app: 20M+ downloads
- Squarespace: 12M+ downloads
Mobile management becoming standard.
Mobile Editing Statistics
Content creation on mobile:
- Content managers using mobile: 58%
- Purely mobile content creation: 12%
- Mobile for quick edits: 76%
- Mobile app satisfaction: 73%
- Prefer desktop for major work: 87%
Mobile serves quick edits. Desktop handles heavy work.
Progressive Web Apps
PWA CMS support:
- CMS platforms supporting PWA: 67%
- WordPress PWA plugins: 45+ available
- Sites implementing PWA: 23%
- Performance improvement: +63% average
PWA adoption grows for better mobile experience.
Content Management Trends
Emerging patterns shape future development.
AI Integration in CMS
Artificial intelligence adoption:
- CMS platforms with AI features: 78%
- AI content generation usage: 34%
- AI SEO optimization: 56%
- AI image tagging: 43%
- AI chatbot integration: 67%
WordPress AI plugins:
- Jetpack AI: 2.4M+ installations
- AI Engine: 500K+ installations
- Content creation tools: Growing 89% YoY
Headless CMS Growth
Decoupled architecture trend:
- Headless CMS market: $1.4 billion (2026)
- Growth rate: +34.7% annually
- JAMstack adoption: 28% of developers
- API-first architecture: 41% of new projects
Benefits driving adoption:
- Omnichannel delivery: 84%
- Performance gains: 76%
- Developer flexibility: 91%
- Future-proofing: 68%
Composable CMS Architecture
Modular approach gains traction:
- Companies adopting composable: 19%
- Planning composable migration: 37%
- MACH architecture (Microservices, API-first, Cloud-native, Headless): 12% adoption
- Composable market growth: +42% annually
Flexibility drives composable interest.
Low-Code CMS Solutions
Democratizing content management:
- Low-code CMS adoption: 31%
- Citizen developers using CMS: 8.7 million
- Development time reduction: Average 68%
- IT burden decreased: 54%
Popular low-code options:
- Webflow: Leading visual development
- Bubble: For web applications
- Airtable: Database-driven content
CMS Security Statistics
Security remains critical concern.
CMS Vulnerability Statistics
Security incident data:
- WordPress sites hacked annually: 90,000+
- Most common attack: Brute force (34%)
- Outdated plugins exploited: 52% of breaches
- Average cost of breach: $487,000
- Sites with security plugins: 68%
Security Best Practices Adoption
Protection measure implementation:
| Security Measure | Adoption Rate | Effectiveness |
| SSL/HTTPS | 91% | Essential |
| Regular updates | 64% | Critical |
| Security plugins | 68% | High |
| Strong passwords | 57% | Medium |
| Two-factor authentication | 42% | Very High |
| Firewall | 53% | High |
| Regular backups | 71% | Essential |
| Security audits | 34% | Very High |
Many sites lack basic security measures.
Most Secure CMS Platforms
Security reputation rankings:
- Craft CMS: Excellent security record
- Statamic: Strong security focus
- Ghost: Minimal attack surface
- Drupal: Enterprise-grade security
- WordPress: Secure core, plugin vulnerabilities
WordPress security improves with proper configuration.
Future CMS Market Predictions
Industry evolution through 2030.
Market Growth Projections
Expected expansion:
- 2027 market: $143.8 billion
- 2028 market: $173.6 billion
- 2030 market: $262.4 billion
- CAGR (2026-2030): 20.7%
Headless CMS fastest growing segment at 34.7% CAGR.
Technology Trends
Emerging capabilities:
- AI-powered content: 67% of platforms by 2028
- Voice interface management: Growing 89%
- Blockchain content verification: Experimental
- AR/VR content delivery: 23% exploring
- Quantum-resistant security: Research phase
Predicted Market Shifts
Industry changes ahead:
- WordPress market share: May decline to 55% by 2030
- Headless/composable: Could reach 35% adoption
- Traditional monolithic: Declining to 45%
- AI-native CMS: Emerging category
- Consolidation: Fewer but stronger platforms
Frequently Asked Questions
Also Read:
- Web Development Statistics
- E-commerce Statistics
- SaaS Statistics
- eLearning Statistics
- Social Media Statistics
Conclusion
The CMS market reached $123.5 billion in 2026, with WordPress commanding 43.2% of all websites.
Headless CMS grows 34.7% annually as organizations seek flexibility, while AI integration and composable architectures reshape content management.
Enterprise adoption increases 16.3% yearly despite security challenges.
Source: CMS Statistics, Statista