Web development powers the digital economy. Websites and applications drive business success globally.
This comprehensive guide covers web development statistics for 2026. You'll discover market size, technology trends, and developer insights.
Let's explore the numbers shaping this critical industry.
Web Development Market Overview
The web development industry grows rapidly. Demand for digital solutions accelerates worldwide.
Global Market Size
Market value and growth metrics:
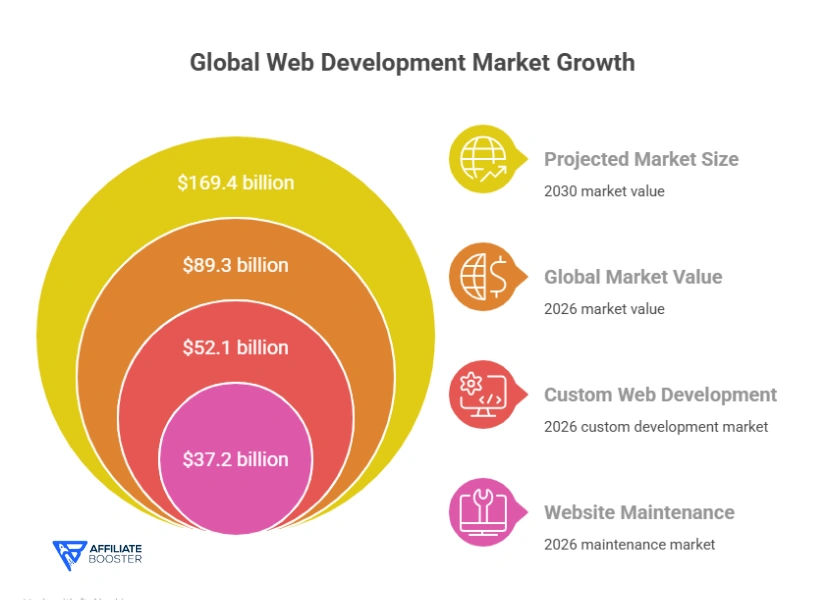
Global web development market (2026): $89.3 billion
Growth from 2025: +13.7%
Projected market size (2030): $169.4 billion
Compound annual growth rate: 14.2%
Custom web development: $52.1 billion (58%)
Website maintenance services: $37.2 billion (42%)
Regional Market Distribution
Geographic breakdown reveals patterns:
Region | Market Size 2026 | Growth Rate | Market Share |
North America | $31.2 billion | 11.8% | 34.9% |
Europe | $24.6 billion | 12.4% | 27.5% |
Asia Pacific | $25.8 billion | 17.3% | 28.9% |
Latin America | $4.9 billion | 15.6% | 5.5% |
Middle East & Africa | $2.8 billion | 18.9% | 3.1% |
North America leads market size. Asia Pacific shows fastest growth.
Industry Demand Drivers
What fuels growth:
Digital transformation initiatives: 78% of businesses
E-commerce expansion: +23% annually
Mobile-first strategies: 89% of companies
Cloud migration: 67% of enterprises
Remote work solutions: Permanent shift for 52%
Also read about: Hostinger Coupon Code (2026) 75% off (3 Mon Free)| Free Domain
Website Statistics
Understanding website landscape reveals opportunities.
Total Websites Worldwide
Global website count:
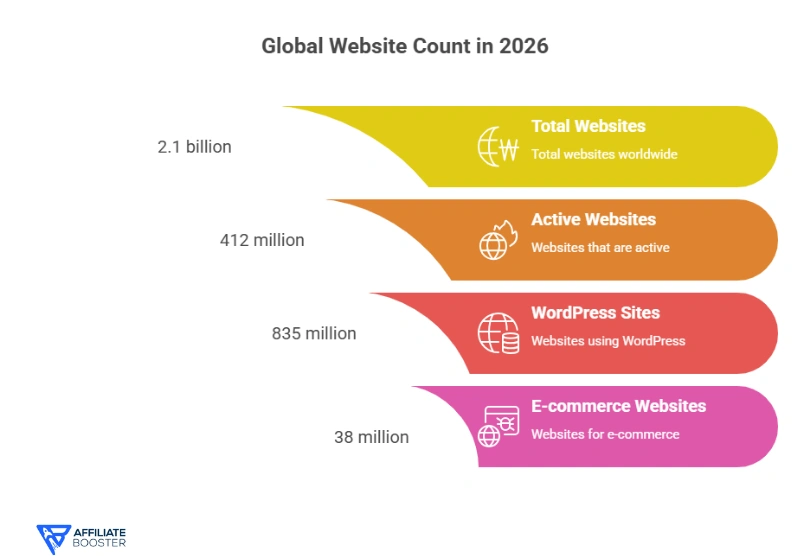
Total websites (2026): 2.1 billion
Active websites: 412 million (20%)
New websites created daily: 547,000
Websites deleted daily: 289,000
WordPress sites: 835 million (40% of all websites)
E-commerce websites: 38 million
Website Technology Stack
Popular platform distribution:
Platform/CMS | Market Share | Active Websites | Growth Rate |
WordPress | 43.2% | 178M | +3.4% |
Shopify | 4.4% | 18M | +19.7% |
Wix | 3.1% | 13M | +8.2% |
Squarespace | 2.8% | 12M | +11.4% |
Joomla | 2.1% | 9M | -2.3% |
Custom/Other | 44.4% | 182M | +5.1% |
WordPress dominates. Shopify grows fastest among major platforms.
Website Performance Metrics
Speed and optimization statistics:
Average page load time: 3.2 seconds (desktop)
Mobile load time: 4.8 seconds
Pages loading under 2 seconds: Only 12%
Bounce rate for slow sites (5+ seconds): 38%
Revenue impact of 1-second delay: -7%
Mobile-optimized sites: 73%
Performance directly impacts business results.
Also read about: 15 Best Web Hosting Affiliate Programs in 2026 – Up to $7000/Sale
Developer Statistics and Demographics
Understanding the workforce reveals industry health.
Global Developer Count
Developer population metrics:
Professional web developers worldwide: 28.7 million
Growth rate: +8.4% annually
Front-end developers: 40% (11.5M)
Back-end developers: 35% (10.0M)
Full-stack developers: 25% (7.2M)
Freelance developers: 34% (9.8M)
Developer population grows faster than most professions.
Geographic Distribution
Where developers work:
United States: 4.8 million developers
India: 5.9 million (largest developer population)
China: 3.2 million
United Kingdom: 1.1 million
Germany: 980,000
Brazil: 870,000
Russia: 780,000
Canada: 650,000
India leads total count. US pays highest salaries.
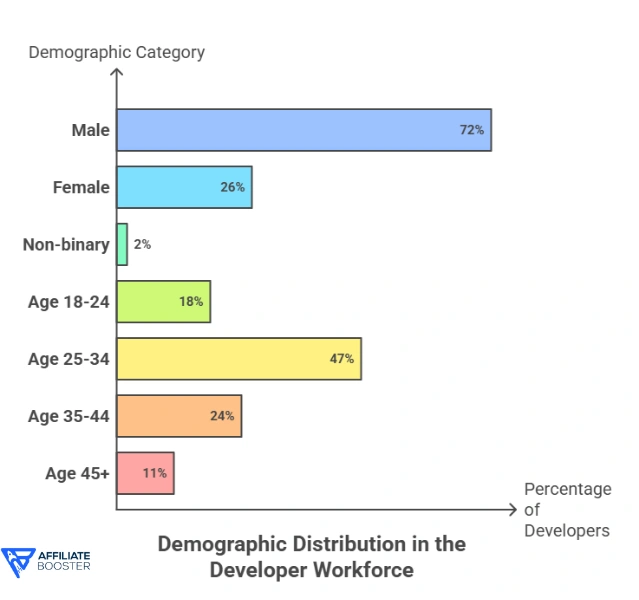
Developer Demographics
Workforce composition:
Demographic | Percentage | Notes |
Male | 72% | Slowly declining |
Female | 26% | Growing representation |
Non-binary | 2% | Increasing visibility |
Age 18-24 | 18% | Entry-level surge |
Age 25-34 | 47% | Peak demographic |
Age 35-44 | 24% | Senior developers |
Age 45+ | 11% | Experienced leaders |
Industry skews young and male but diversifying.
Developer Education
Educational background:
Computer Science degree: 41%
Self-taught: 32%
Bootcamp graduates: 18%
Other degree + coding: 9%
Master's/PhD: 23%
Continue learning weekly: 89%
Self-education plays major role. Continuous learning essential.
Also read about: Miss Hosting Coupon Codes 2026: Get Up to 84% Off!
Programming Language Statistics
Technology choices shape development landscape.
Most Popular Languages
Usage rankings for web development:
Language | Usage Rate | Primary Use | Growth |
JavaScript | 67.8% | Front-end, full-stack | +2.1% |
Python | 49.3% | Back-end, data | +7.8% |
TypeScript | 38.9% | Front-end, full-stack | +15.4% |
Java | 33.1% | Enterprise back-end | -1.2% |
PHP | 26.7% | Back-end (legacy) | -3.4% |
C# | 23.4% | .NET development | +1.8% |
Go | 12.8% | Backend, APIs | +9.7% |
Ruby | 7.2% | Back-end (Rails) | -2.1% |
JavaScript dominates. TypeScript grows fastest.
JavaScript Framework Popularity
Front-end framework usage:
React: 42.6% of developers (most popular)
Vue.js: 18.9%
Angular: 17.4%
Svelte: 9.7% (fastest growing +67%)
Next.js: 16.2%
jQuery: 21.3% (legacy, declining)
Vanilla JavaScript: 34.8%
React maintains leadership. Svelte gains momentum.
Backend Framework Statistics
Server-side framework adoption:
Node.js/Express: 47.1%
Django (Python): 14.2%
Flask (Python): 11.8%
Laravel (PHP): 10.3%
Spring (Java): 9.7%
Ruby on Rails: 5.4%
ASP.NET Core: 8.9%
Node.js dominates backend JavaScript development.
Also read about: GoDaddy VPS Hosting Coupon Codes 2026: Get up to 41% off
Mobile and Responsive Design
Mobile-first approach becomes mandatory.
Mobile Traffic Statistics
Mobile dominance:
Mobile traffic percentage: 63.4% of all web traffic
Desktop traffic: 33.1%
Tablet traffic: 3.5%
Mobile-optimized sites: 73%
Sites failing mobile test: 27%
Mobile conversion rate: 2.8% (vs 4.1% desktop)
Mobile traffic dominates but converts lower.
Responsive Design Adoption
Mobile-friendly implementation:
Websites using responsive design: 86%
Mobile-first development approach: 67%
Separate mobile sites (m.domain): 8% (declining)
No mobile optimization: 6%
Progressive web apps: 14% (growing rapidly)
Responsive design becomes standard practice.
Mobile Performance
Speed on smartphones:
Average mobile page load: 4.8 seconds
Acceptable mobile load time: Under 3 seconds
Mobile pages under 3 seconds: Only 18%
53% of mobile users abandon sites taking 3+ seconds
Mobile page size average: 2.1 MB
Images comprise: 64% of page weight
Mobile performance lags behind desktop significantly.
E-commerce Development Statistics
Online shopping drives web development demand.
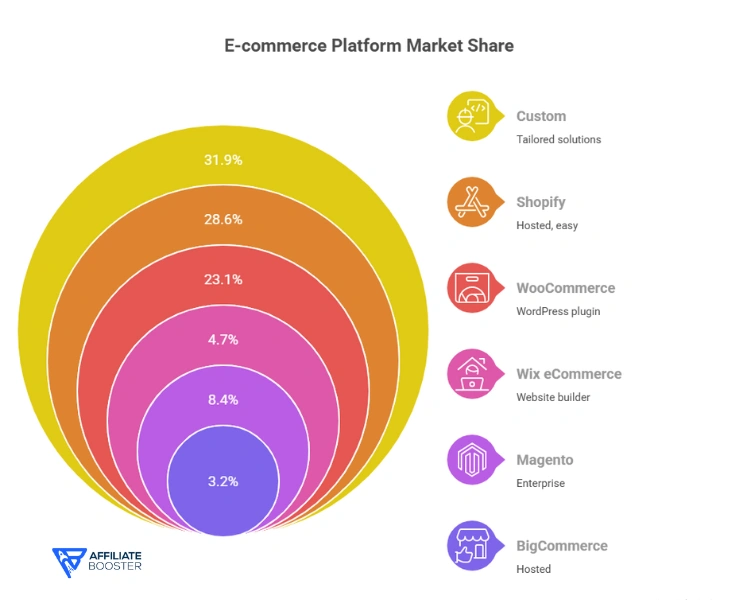
E-commerce Platform Usage
Shopping cart market share:
Platform | Market Share | Active Stores | Features |
Shopify | 28.6% | 4.8M | Hosted, easy |
WooCommerce | 23.1% | 6.4M | WordPress plugin |
Magento | 8.4% | 250K | Enterprise |
BigCommerce | 3.2% | 60K | Hosted |
Wix eCommerce | 4.7% | 500K | Website builder |
Custom | 31.9% | Various | Tailored solutions |
Shopify leads hosted solutions. WooCommerce dominates WordPress.
E-commerce Development Costs
Average project expenses:
Basic e-commerce site: $5,000-$15,000
Mid-range custom store: $15,000-$50,000
Enterprise e-commerce: $50,000-$500,000+
Monthly maintenance: $500-$5,000
Average hourly rate: $75-$200
Costs vary dramatically by complexity and location.
Conversion Rate Optimization
CRO impact statistics:
Average e-commerce conversion rate: 2.86%
Top 10% of sites: 11.2%+
A/B testing adoption: 61% of companies
Revenue lift from CRO: Average +20%
Companies doing CRO: 68%
Small improvements generate significant revenue increases.
Web Development Costs and Pricing
Understanding pricing helps budget planning.
Average Project Costs
Development pricing breakdown:
Project Type | Average Cost | Timeline | Complexity |
Landing page | $1,000-$3,000 | 1-2 weeks | Simple |
Small business site | $3,000-$10,000 | 2-6 weeks | Basic |
Corporate website | $10,000-$50,000 | 2-4 months | Medium |
E-commerce store | $15,000-$100,000 | 3-6 months | High |
Web application | $50,000-$500,000+ | 6-18 months | Very high |
Enterprise solution | $500,000-$5M+ | 12-36 months | Complex |
Developer Hourly Rates
Global rate comparison:
North America: $100-$200/hour
Western Europe: $80-$150/hour
Eastern Europe: $35-$75/hour
Latin America: $30-$60/hour
Asia (India/Philippines): $15-$40/hour
Australia: $90-$180/hour
Location dramatically impacts development costs.
Freelance vs Agency Costs
Engagement model pricing:
Freelance developer: $35-$150/hour
Small agency (5-15): $75-$150/hour
Mid-size agency (15-50): $100-$200/hour
Large agency (50+): $150-$300/hour
Offshore development: $20-$60/hour
Agencies cost more but offer broader expertise.
Web Development Trends
Emerging technologies reshape industry.
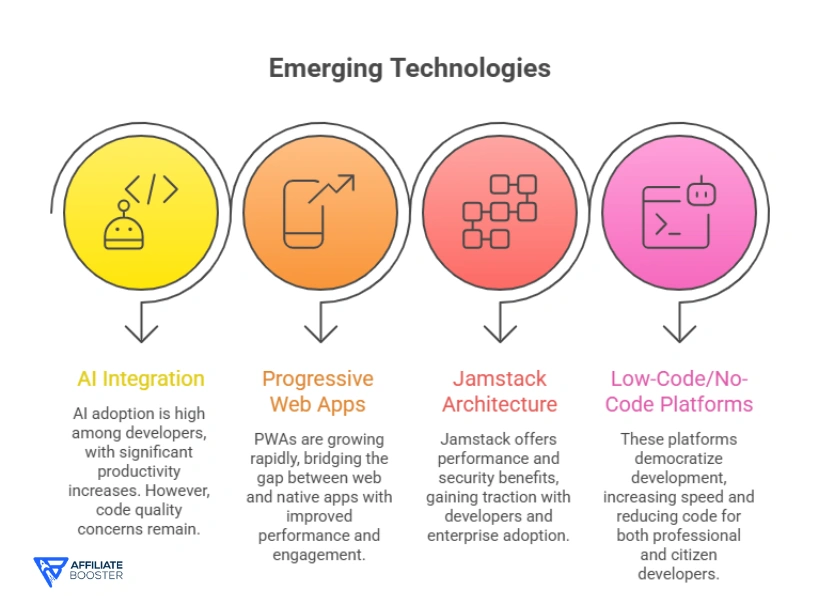
AI Integration Statistics
Artificial intelligence adoption:
Developers using AI tools: 73%
GitHub Copilot adoption: 34% of developers
ChatGPT for coding: 58%
AI-generated code percentage: Average 26%
Productivity increase with AI: +35%
Code quality concerns: 47% worry about AI errors
AI transforms development workflows dramatically.
Progressive Web Apps (PWA)
PWA adoption metrics:
Companies using PWAs: 14% (growing rapidly)
PWA growth rate: +34% annually
Average performance improvement: +63%
Engagement increase: +137%
Conversion rate lift: +52%
Major brands with PWAs: 67% of Fortune 500
PWAs bridge gap between web and native apps.
Jamstack Architecture
Modern development approach:
Developers using Jamstack: 28%
Growth rate: +41% year-over-year
Performance improvement: Average +57%
Security benefit: -80% attack surface
Popular Jamstack frameworks: Next.js, Gatsby, Nuxt
Enterprise adoption: 42%
Jamstack gains traction for performance and security.
Low-Code/No-Code Platforms
Democratization of development:
Market size (2026): $26.9 billion
Growth rate: +31.8% annually
Professional developers using low-code: 47%
Citizen developers: 15.3 million globally
Development speed increase: +70%
Code reduction: Average 60-80%
Low-code empowers non-developers while boosting professional productivity.
Web Security Statistics
Security concerns drive development decisions.
Cyber Attack Frequency
Threat landscape data:
Websites attacked daily: 30,000+
Average attacks per website yearly: 44
Data breaches (2025): 3,205 incidents
Average breach cost: $4.88 million
Malware infections daily: 560,000
DDoS attacks annually: 12+ million
Cyber threats intensify continuously.
Common Vulnerabilities
Security weakness distribution:
Vulnerability | Percentage | Impact Level |
Outdated software | 37% | Critical |
SQL injection | 23% | Critical |
Cross-site scripting (XSS) | 28% | High |
Broken authentication | 19% | Critical |
Misconfiguration | 34% | Medium-High |
Missing encryption | 21% | High |
Outdated software remains biggest vulnerability.
SSL/HTTPS Adoption
Encryption implementation:
Websites using HTTPS: 87% (up from 34% in 2017)
Chrome marks non-HTTPS as “Not Secure”: Yes
SEO benefit of HTTPS: Minor ranking factor
SSL certificate cost: $0-$300 annually
Free certificates (Let's Encrypt): 64% adoption
HTTPS becomes universal standard.
Security Investment
Spending on protection:
Average security budget: 14% of development costs
Companies with security audits: 68%
Penetration testing frequency: Quarterly for 34%
Security training for developers: 58% of companies
DevSecOps adoption: 51%
Security investment increases but gaps remain.
Developer Salary Statistics
Compensation reflects demand and location.
Average Salaries by Role
Annual compensation in US:
Junior developer: $65,000-$85,000
Mid-level developer: $85,000-$120,000
Senior developer: $120,000-$175,000
Lead developer: $140,000-$200,000
Solutions architect: $150,000-$220,000
CTO/VP Engineering: $180,000-$400,000+
Salary by Technology
Premium for specific skills:
Technology | Average Salary (US) | Demand Level |
React | $118,000 | Very High |
Python | $122,000 | Very High |
Node.js | $115,000 | High |
Java | $112,000 | High |
Go | $135,000 | High |
Ruby | $108,000 | Medium |
PHP | $95,000 | Medium |
TypeScript | $125,000 | Very High |
Modern frameworks command premium salaries.
Remote Work Impact
Work-from-home effect on compensation:
Fully remote developers: 58%
Hybrid workers: 31%
Office-based only: 11%
Remote salary adjustment: -5% to -15% (location-based)
Remote job satisfaction: +23% versus office
Companies offering remote: 89%
Remote work becomes permanent for majority.
Future Web Development Predictions
Industry trajectory through 2030.
Market Growth Projections
Expected expansion:
2027 market size: $101.2 billion
2028 market size: $115.4 billion
2030 market size: $169.4 billion
CAGR (2026-2030): 14.2%
Developer shortage by 2030: -4.3 million positions
Demand outpaces supply creating opportunities.
Emerging Technologies
Next-generation innovations:
WebAssembly adoption: Growing +89% annually
Web3/blockchain integration: 23% of developers experimenting
Voice interface development: +67% growth
AR/VR web experiences: 34% of brands exploring
Quantum computing prep: Early research phase
Bleeding-edge tech reshapes possibilities.
Skills in Demand
Most sought capabilities 2026-2030:
AI/ML integration: Demand +127%
Cloud architecture: +89%
Cybersecurity: +94%
Mobile development: +67%
DevOps/automation: +78%
Blockchain: +156%
Specialized skills command premium compensation.
FAQs About Web Development Statistics
How big is the web development market?
The global web development market reached $89.3 billion in 2026, growing 13.7% from 2025. It's projected to reach $169.4 billion by 2030, with a compound annual growth rate of 14.2%.
How many web developers are there worldwide?
There are 28.7 million professional web developers globally in 2026, growing 8.4% annually. This includes 11.5 million front-end, 10 million back-end, and 7.2 million full-stack developers.
What programming language is most popular for web development?
JavaScript leads at 67.8% usage, followed by Python (49.3%) and TypeScript (38.9%). For frameworks, React dominates at 42.6%, while Node.js leads backend at 47.1%.
How much does website development cost?
Costs range from $1,000-$3,000 for landing pages to $50,000-$500,000+ for web applications. Average small business sites cost $3,000-$10,000, while e-commerce stores run $15,000-$100,000.
What percentage of websites are mobile-optimized?
73% of websites are mobile-optimized in 2026, with 86% using responsive design. However, only 18% of mobile pages load under the recommended 3 seconds, indicating performance issues.
Also Read About:
Conclusion
Web development reached $89.3 billion in 2026, with 28.7 million developers worldwide.
JavaScript and React dominate technology choices, while mobile-first design becomes mandatory.
AI tools boost productivity 35%, and remote work defines 58% of positions, reshaping traditional development workflows permanently.
Source: Statista, Bureau of Labor